Dashboard Examples
Application Study Tool includes a variety of starter dashboards to help monitor your BigIP devices. These dashboards are built in Grafana and can be customized to suit your unique organizational needs.
Accessing the dashboards
View The Dashboards
Once you have deployed the application, you can access the dashboards at http://<hostname>:3000, the default Grafana user/pass is admin/admin.
- Grafana Instance with pre-configured dashboards for quick insights at the device and “fleet” levels.
Changing the Grafana Credentials
You can update the Grafana user/pass by changing the values of the GF_SECURITY_ADMIN_USER and GF_SECURITY_ADMIN_PASSWORD .env variables
Fleet Dashboards
The fleet dashboards provide top level information of your environment
Inventory
The inventory dashboard allows you to view the differences between BigIP devices in your inventory. 
Device Utilization
This dashboard provides a quick view on how much usage your box is receiving. To view more information about the device take a look at the device overview dashboard. 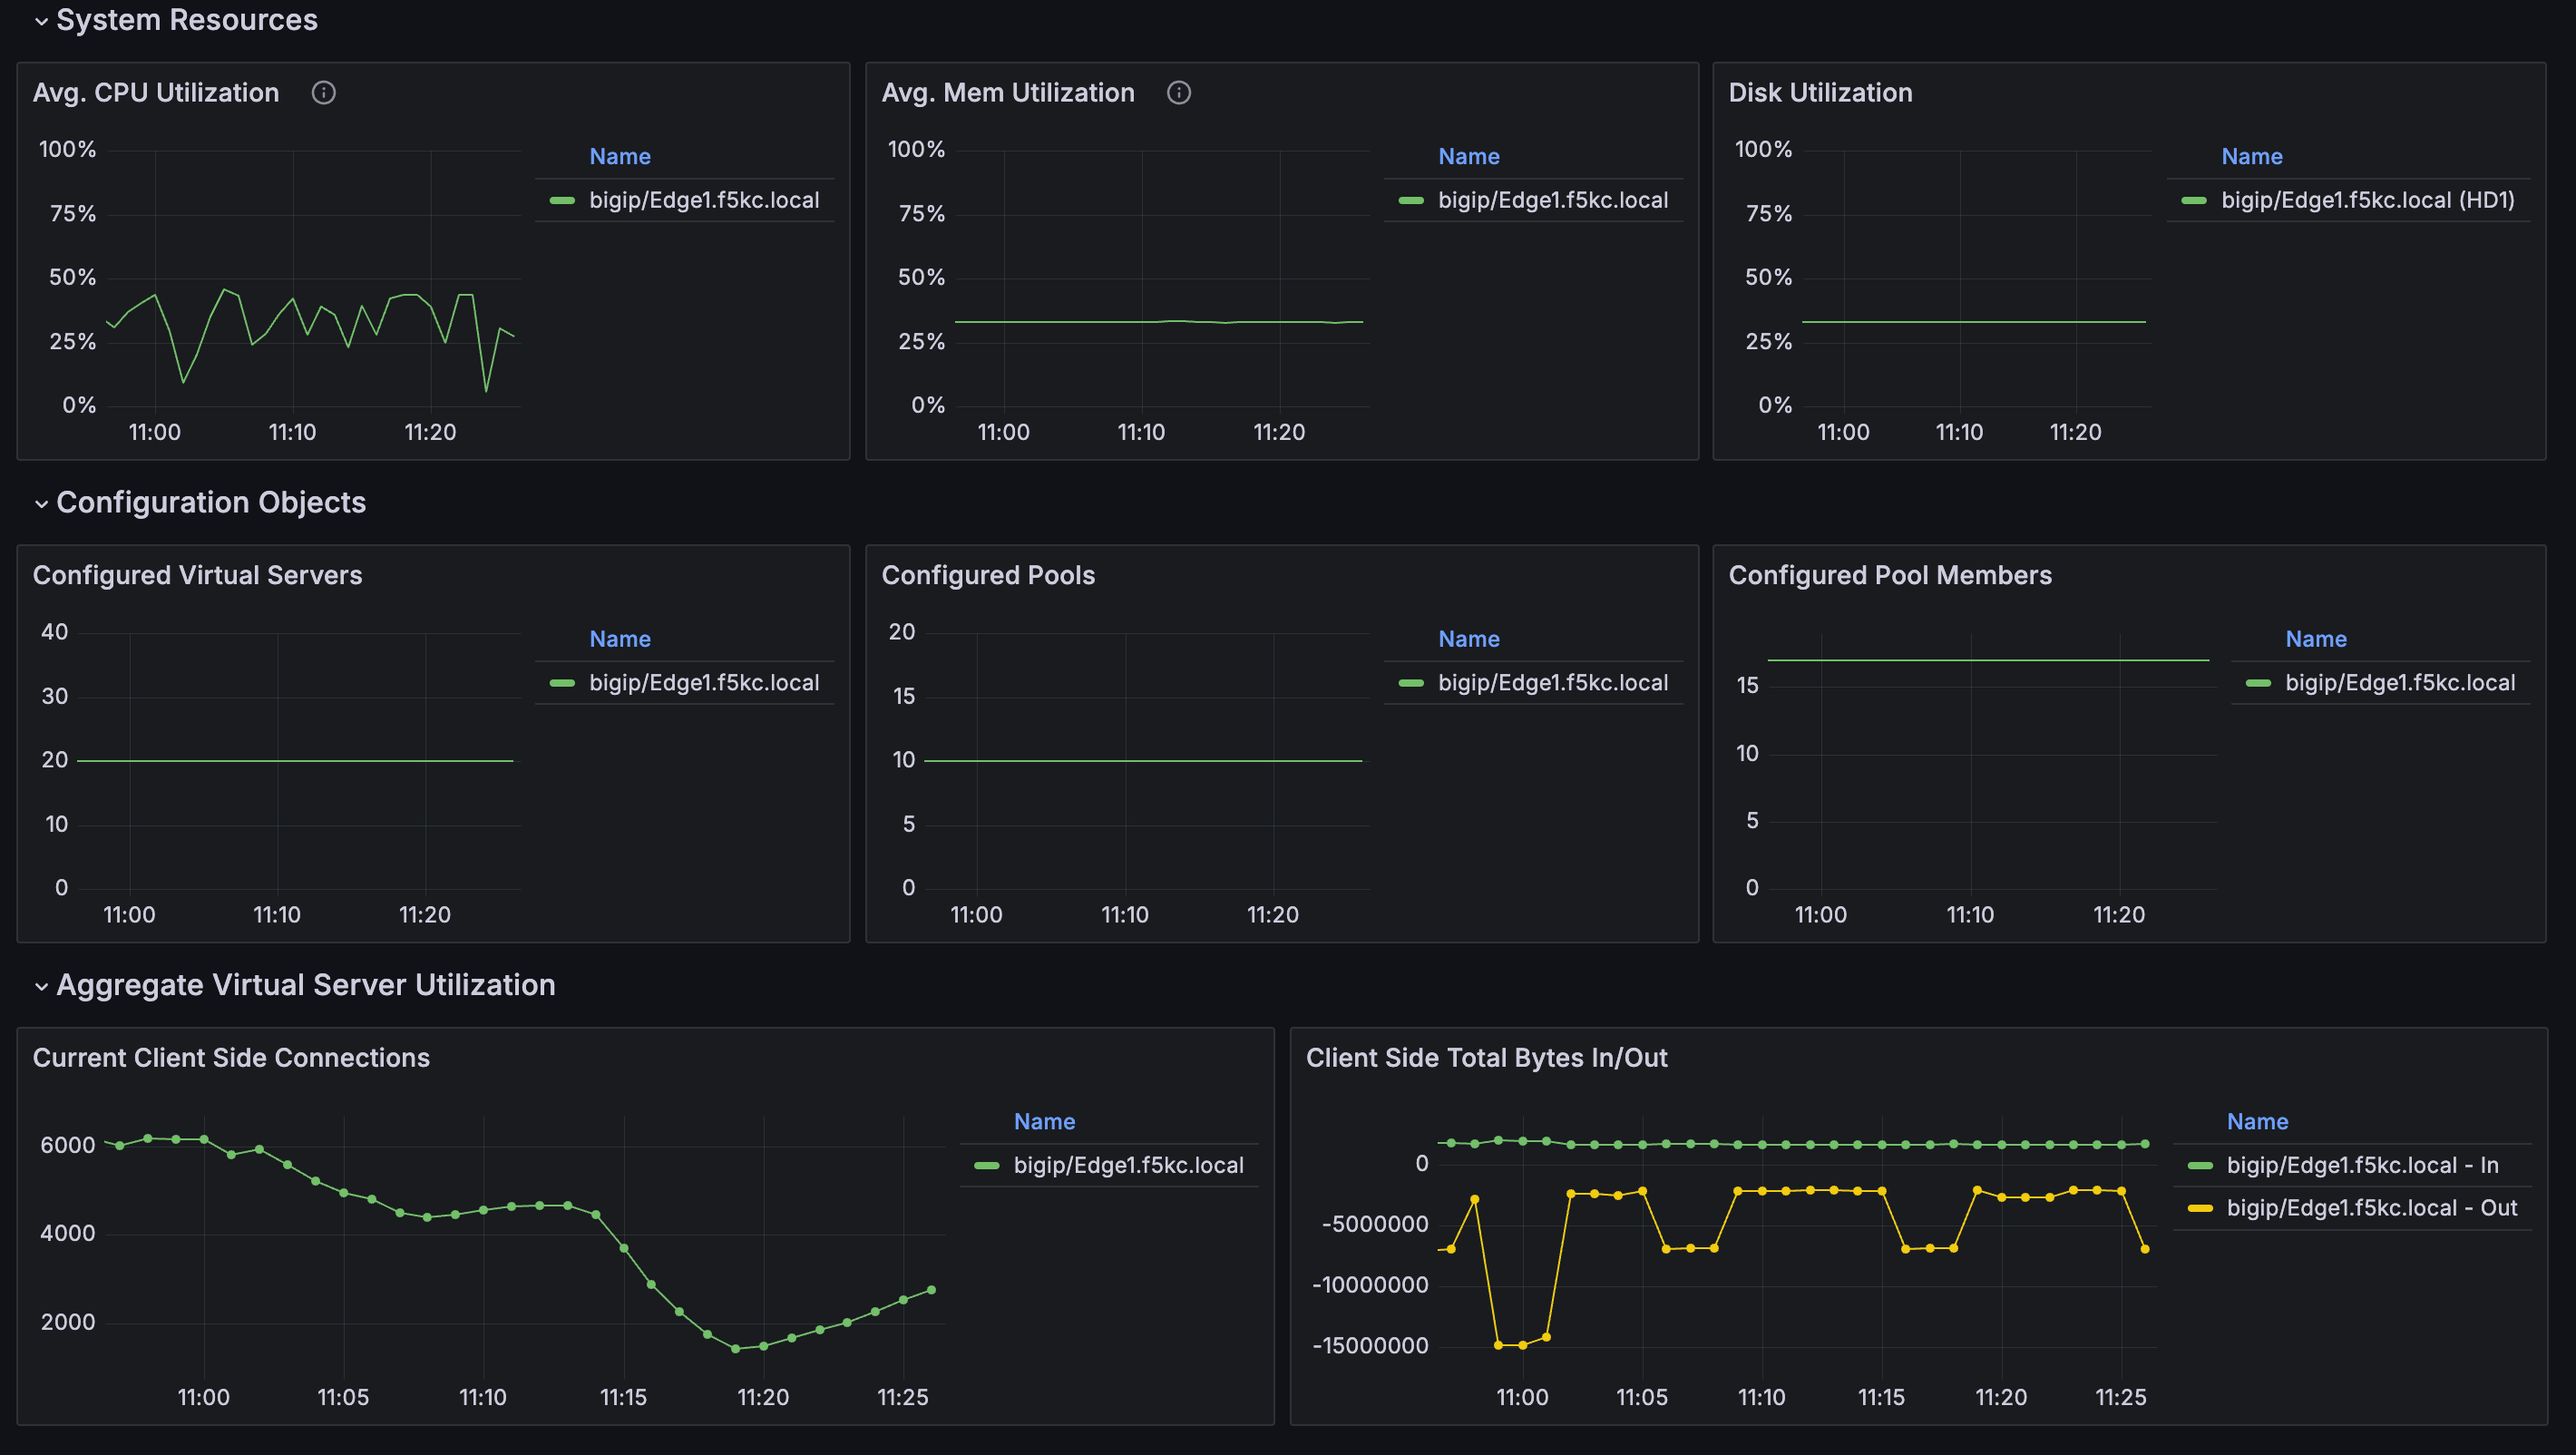
Virtual Servers
The Virtual Server dashboard provides an overview of all the virtual servers present in your inventory. 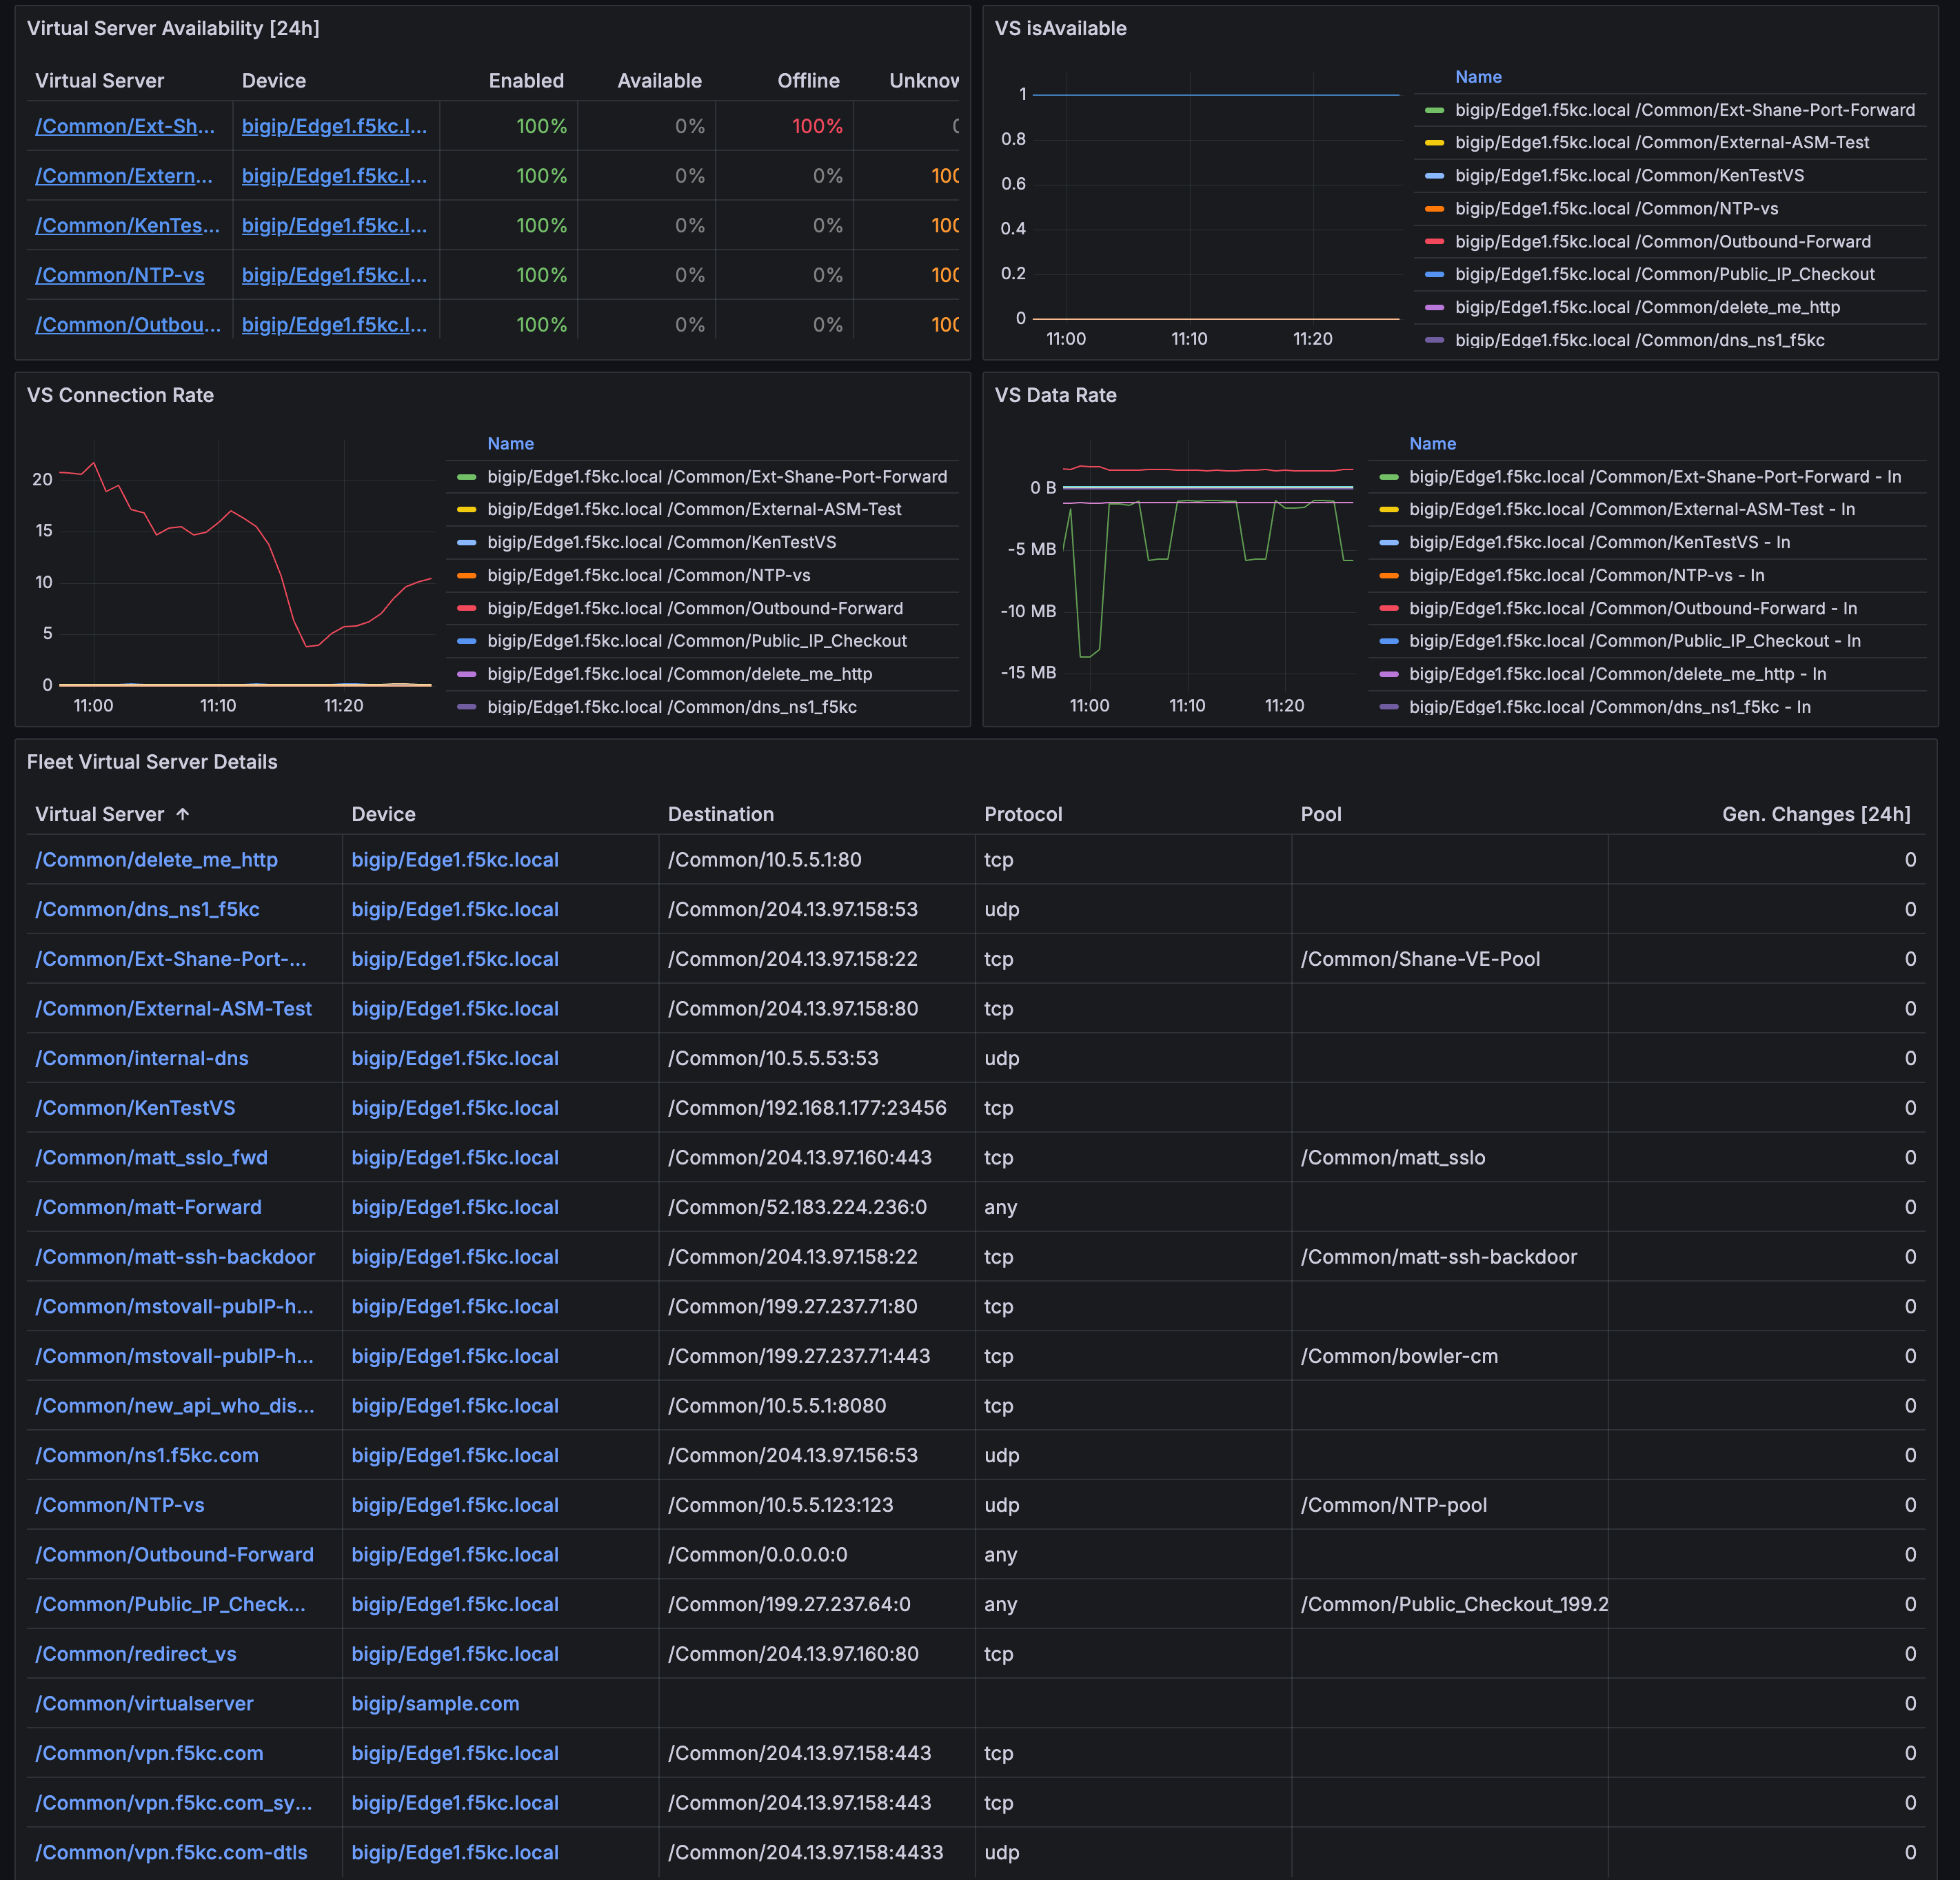
SSL Certs
The SSL Certs view allows you to stay up to date on the status of your SSL certficates. 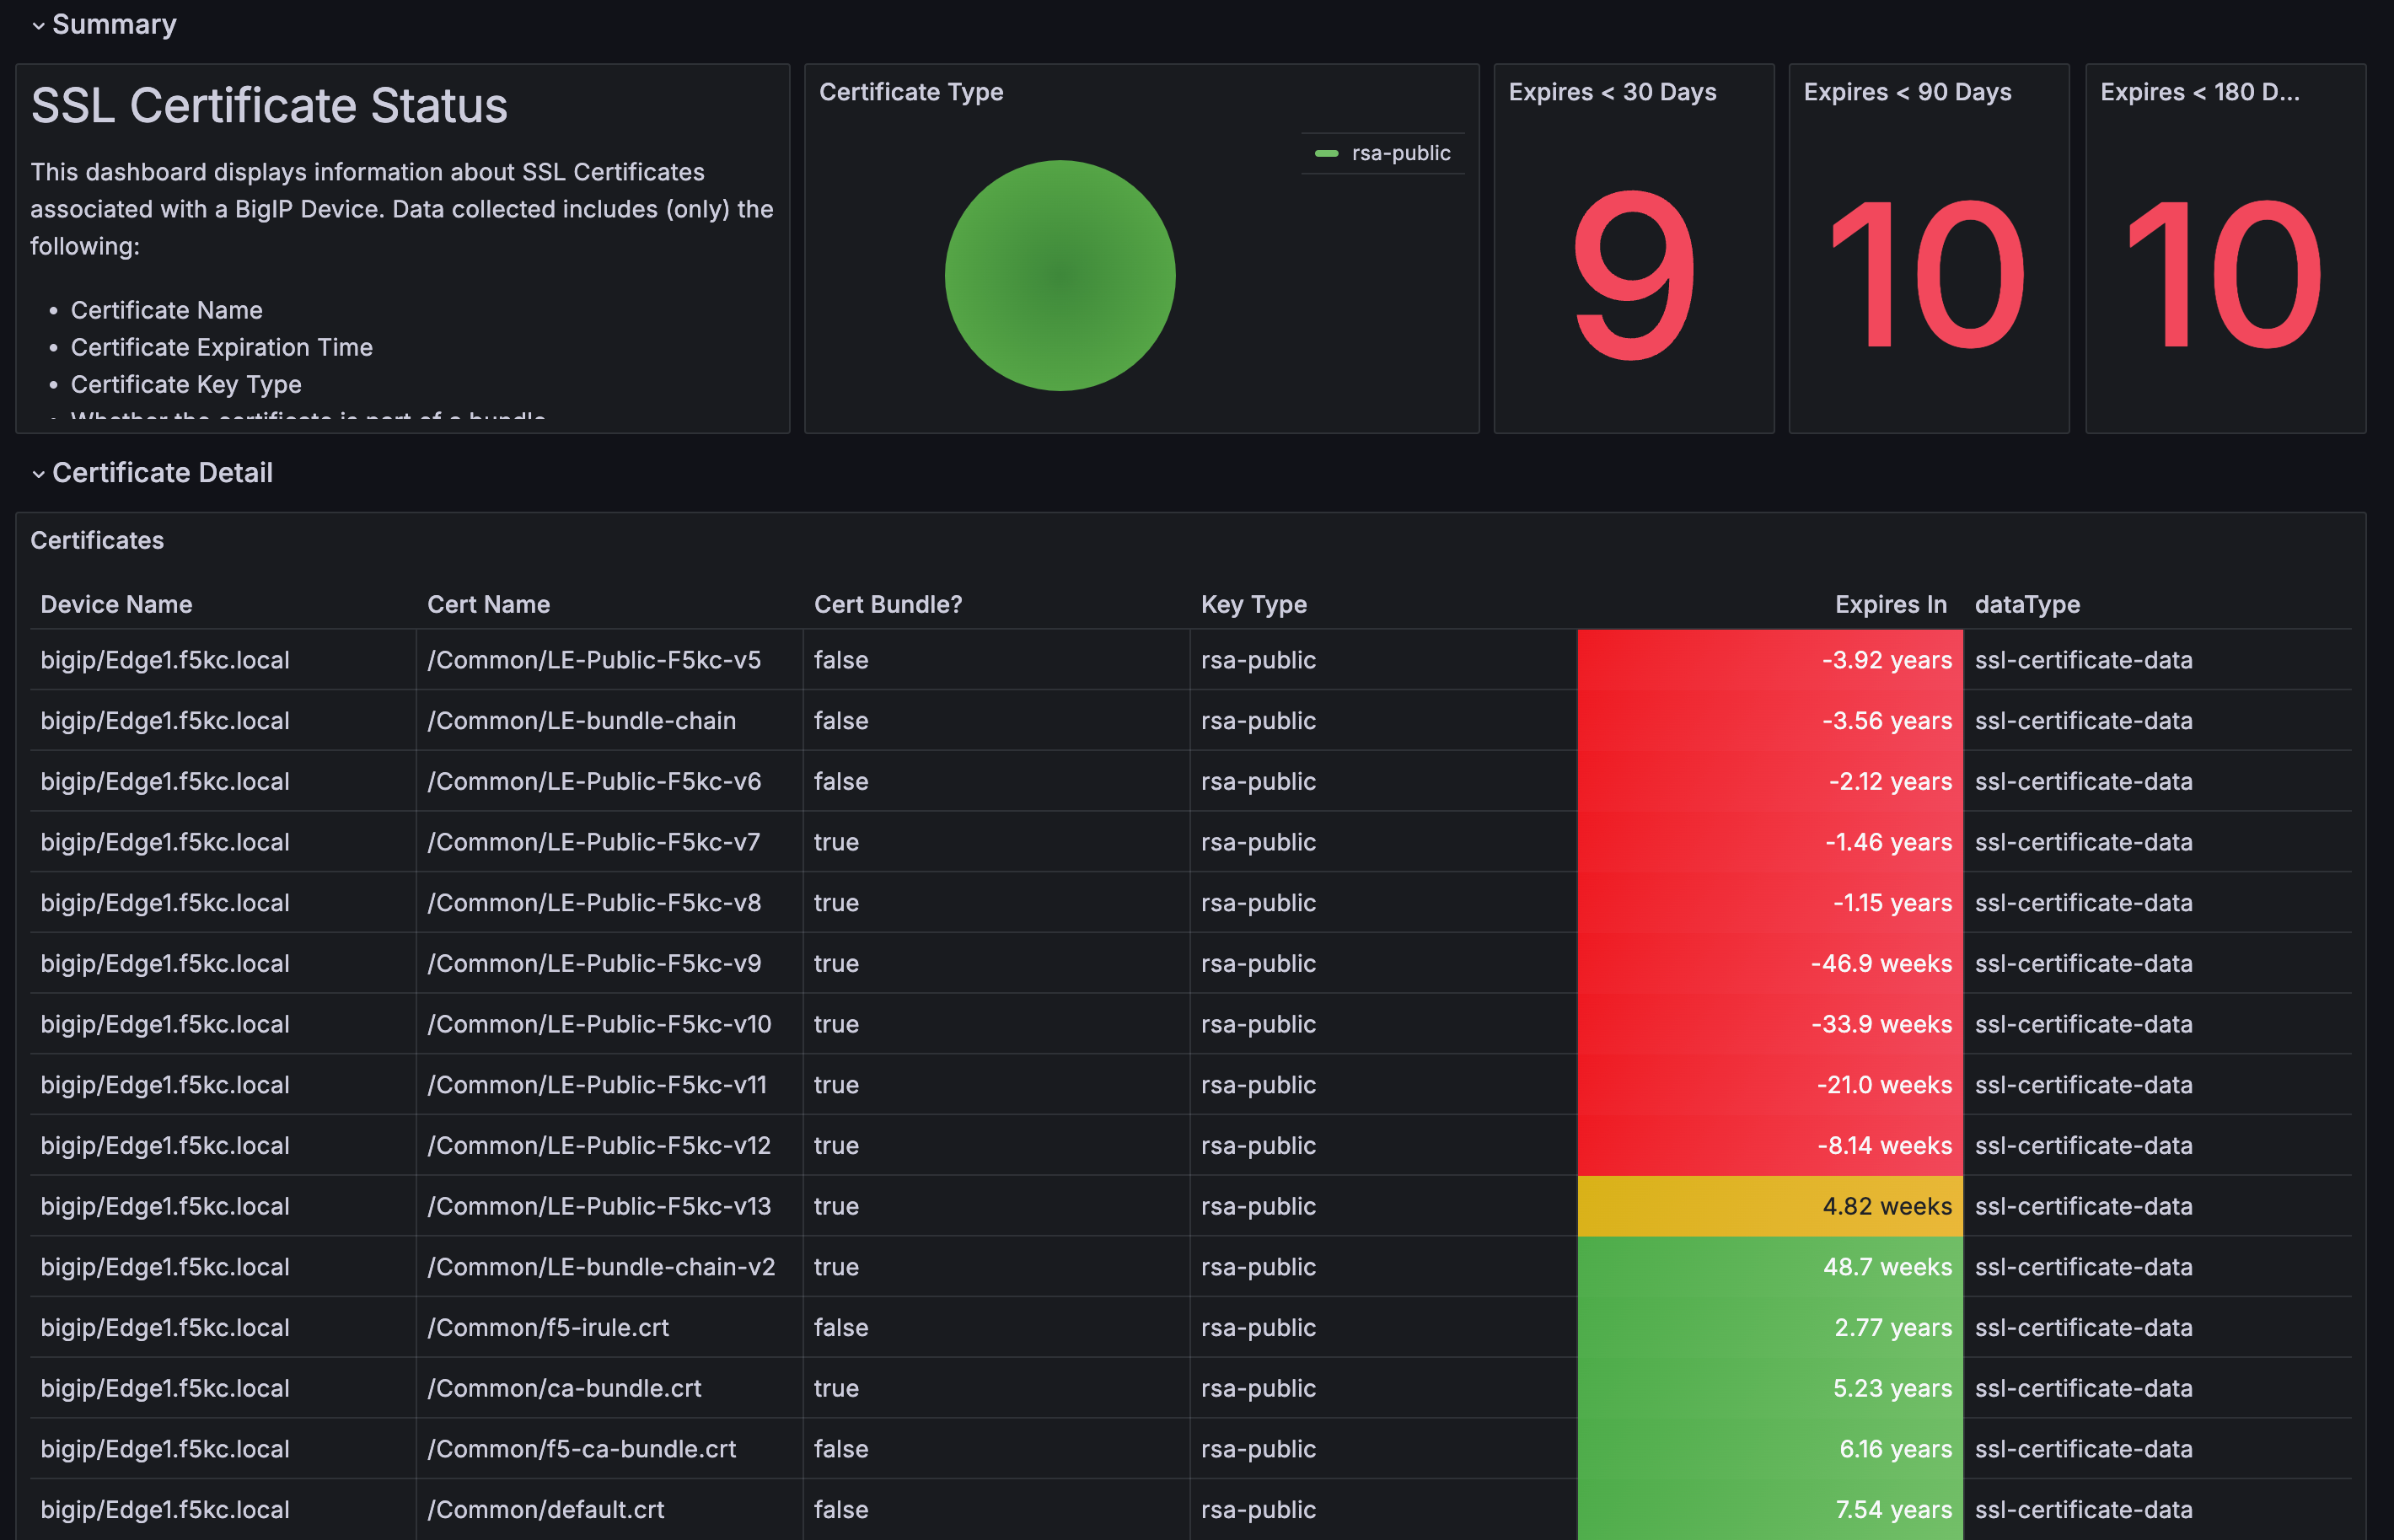
Device Dashboards
The device dashboards provide more grainular information about how the device is configured and how it is performing
Overview
This dashboard provides variety of metrics about the performance of the device. 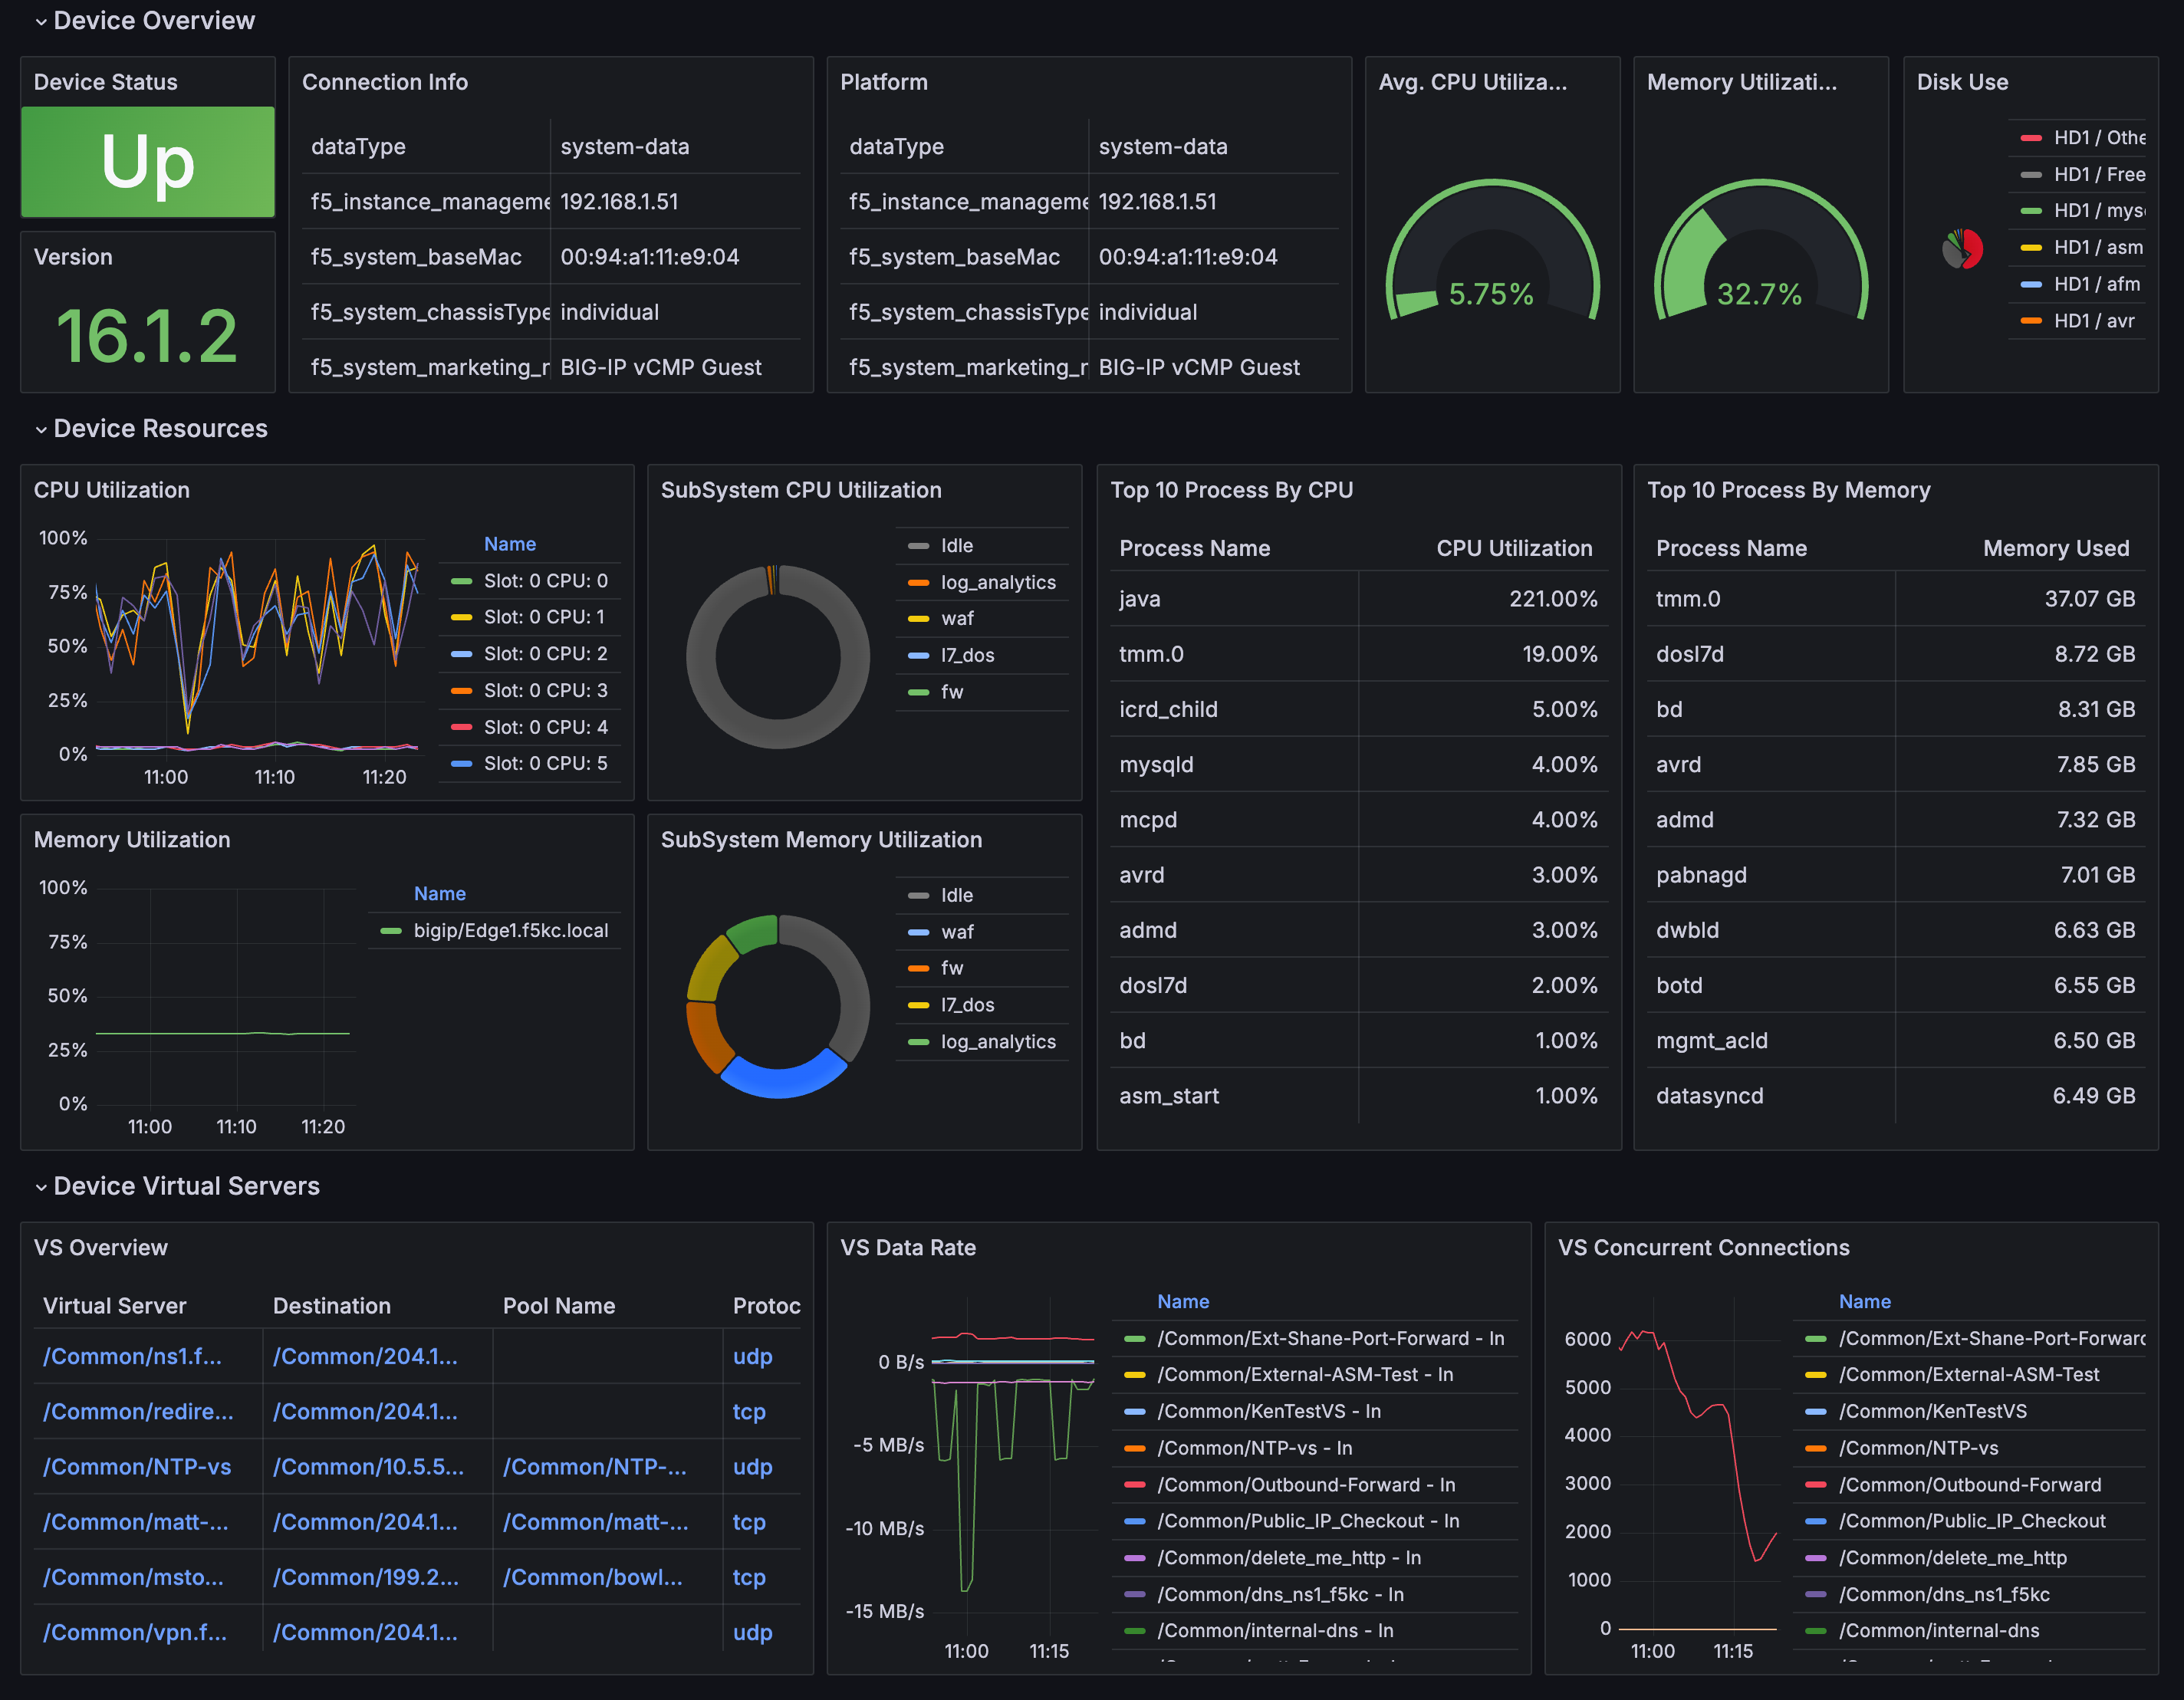
Top N
The Top N dashboard provides statistical highlights by presenting stats in a Top N, by default N is set to 10 this can be changed at top of the dashboard 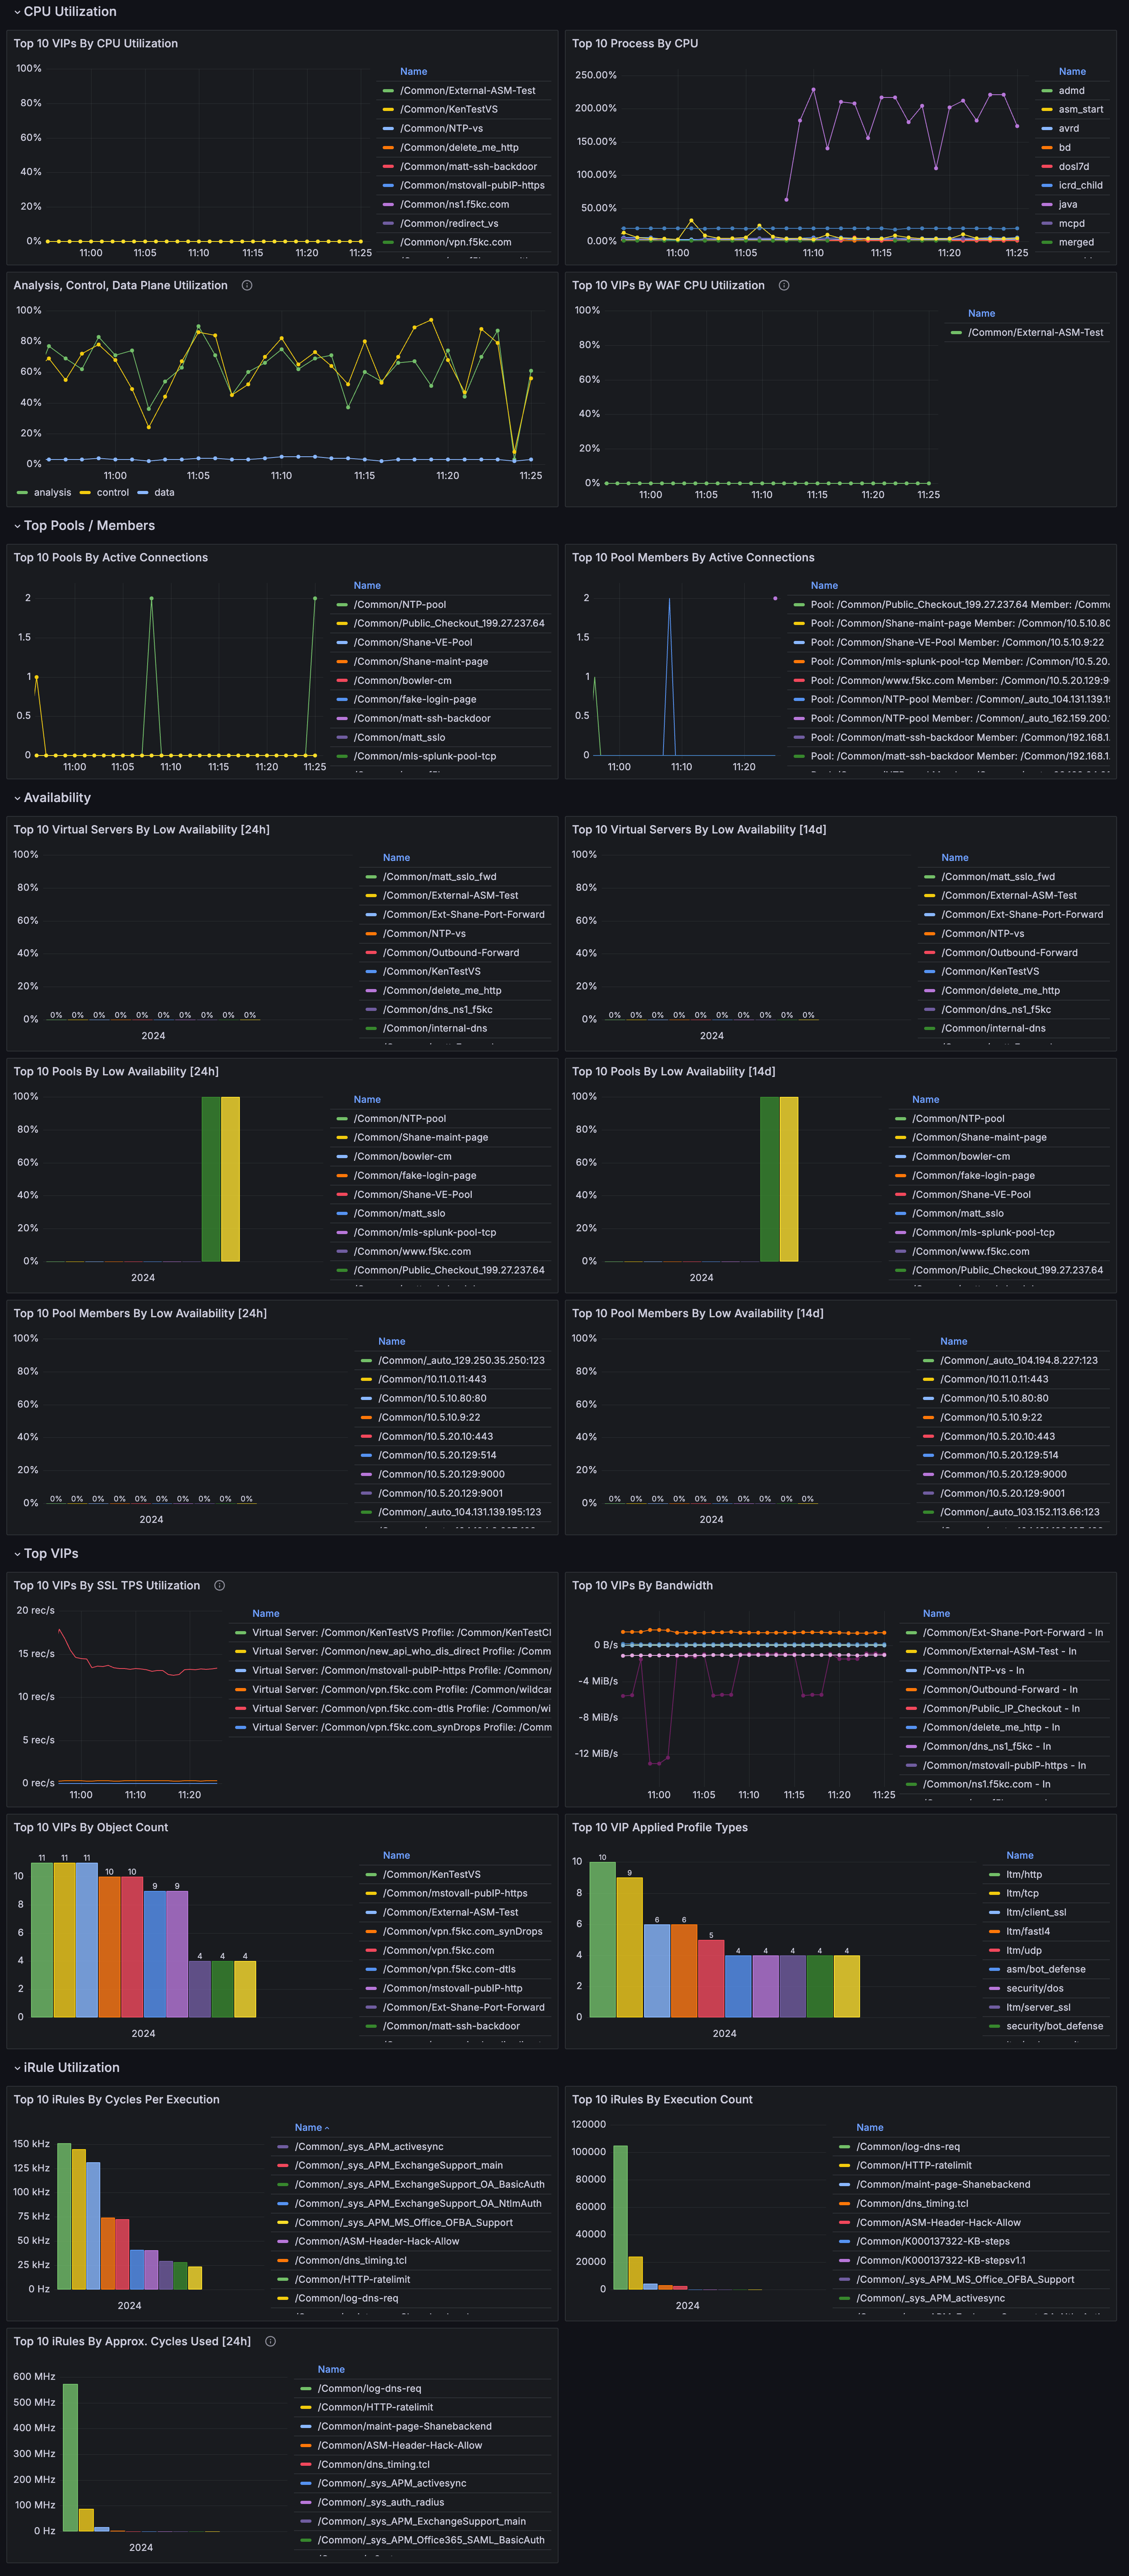
Pools
Here you can view stats pertaining to Pools and Pool members on a BigIP. 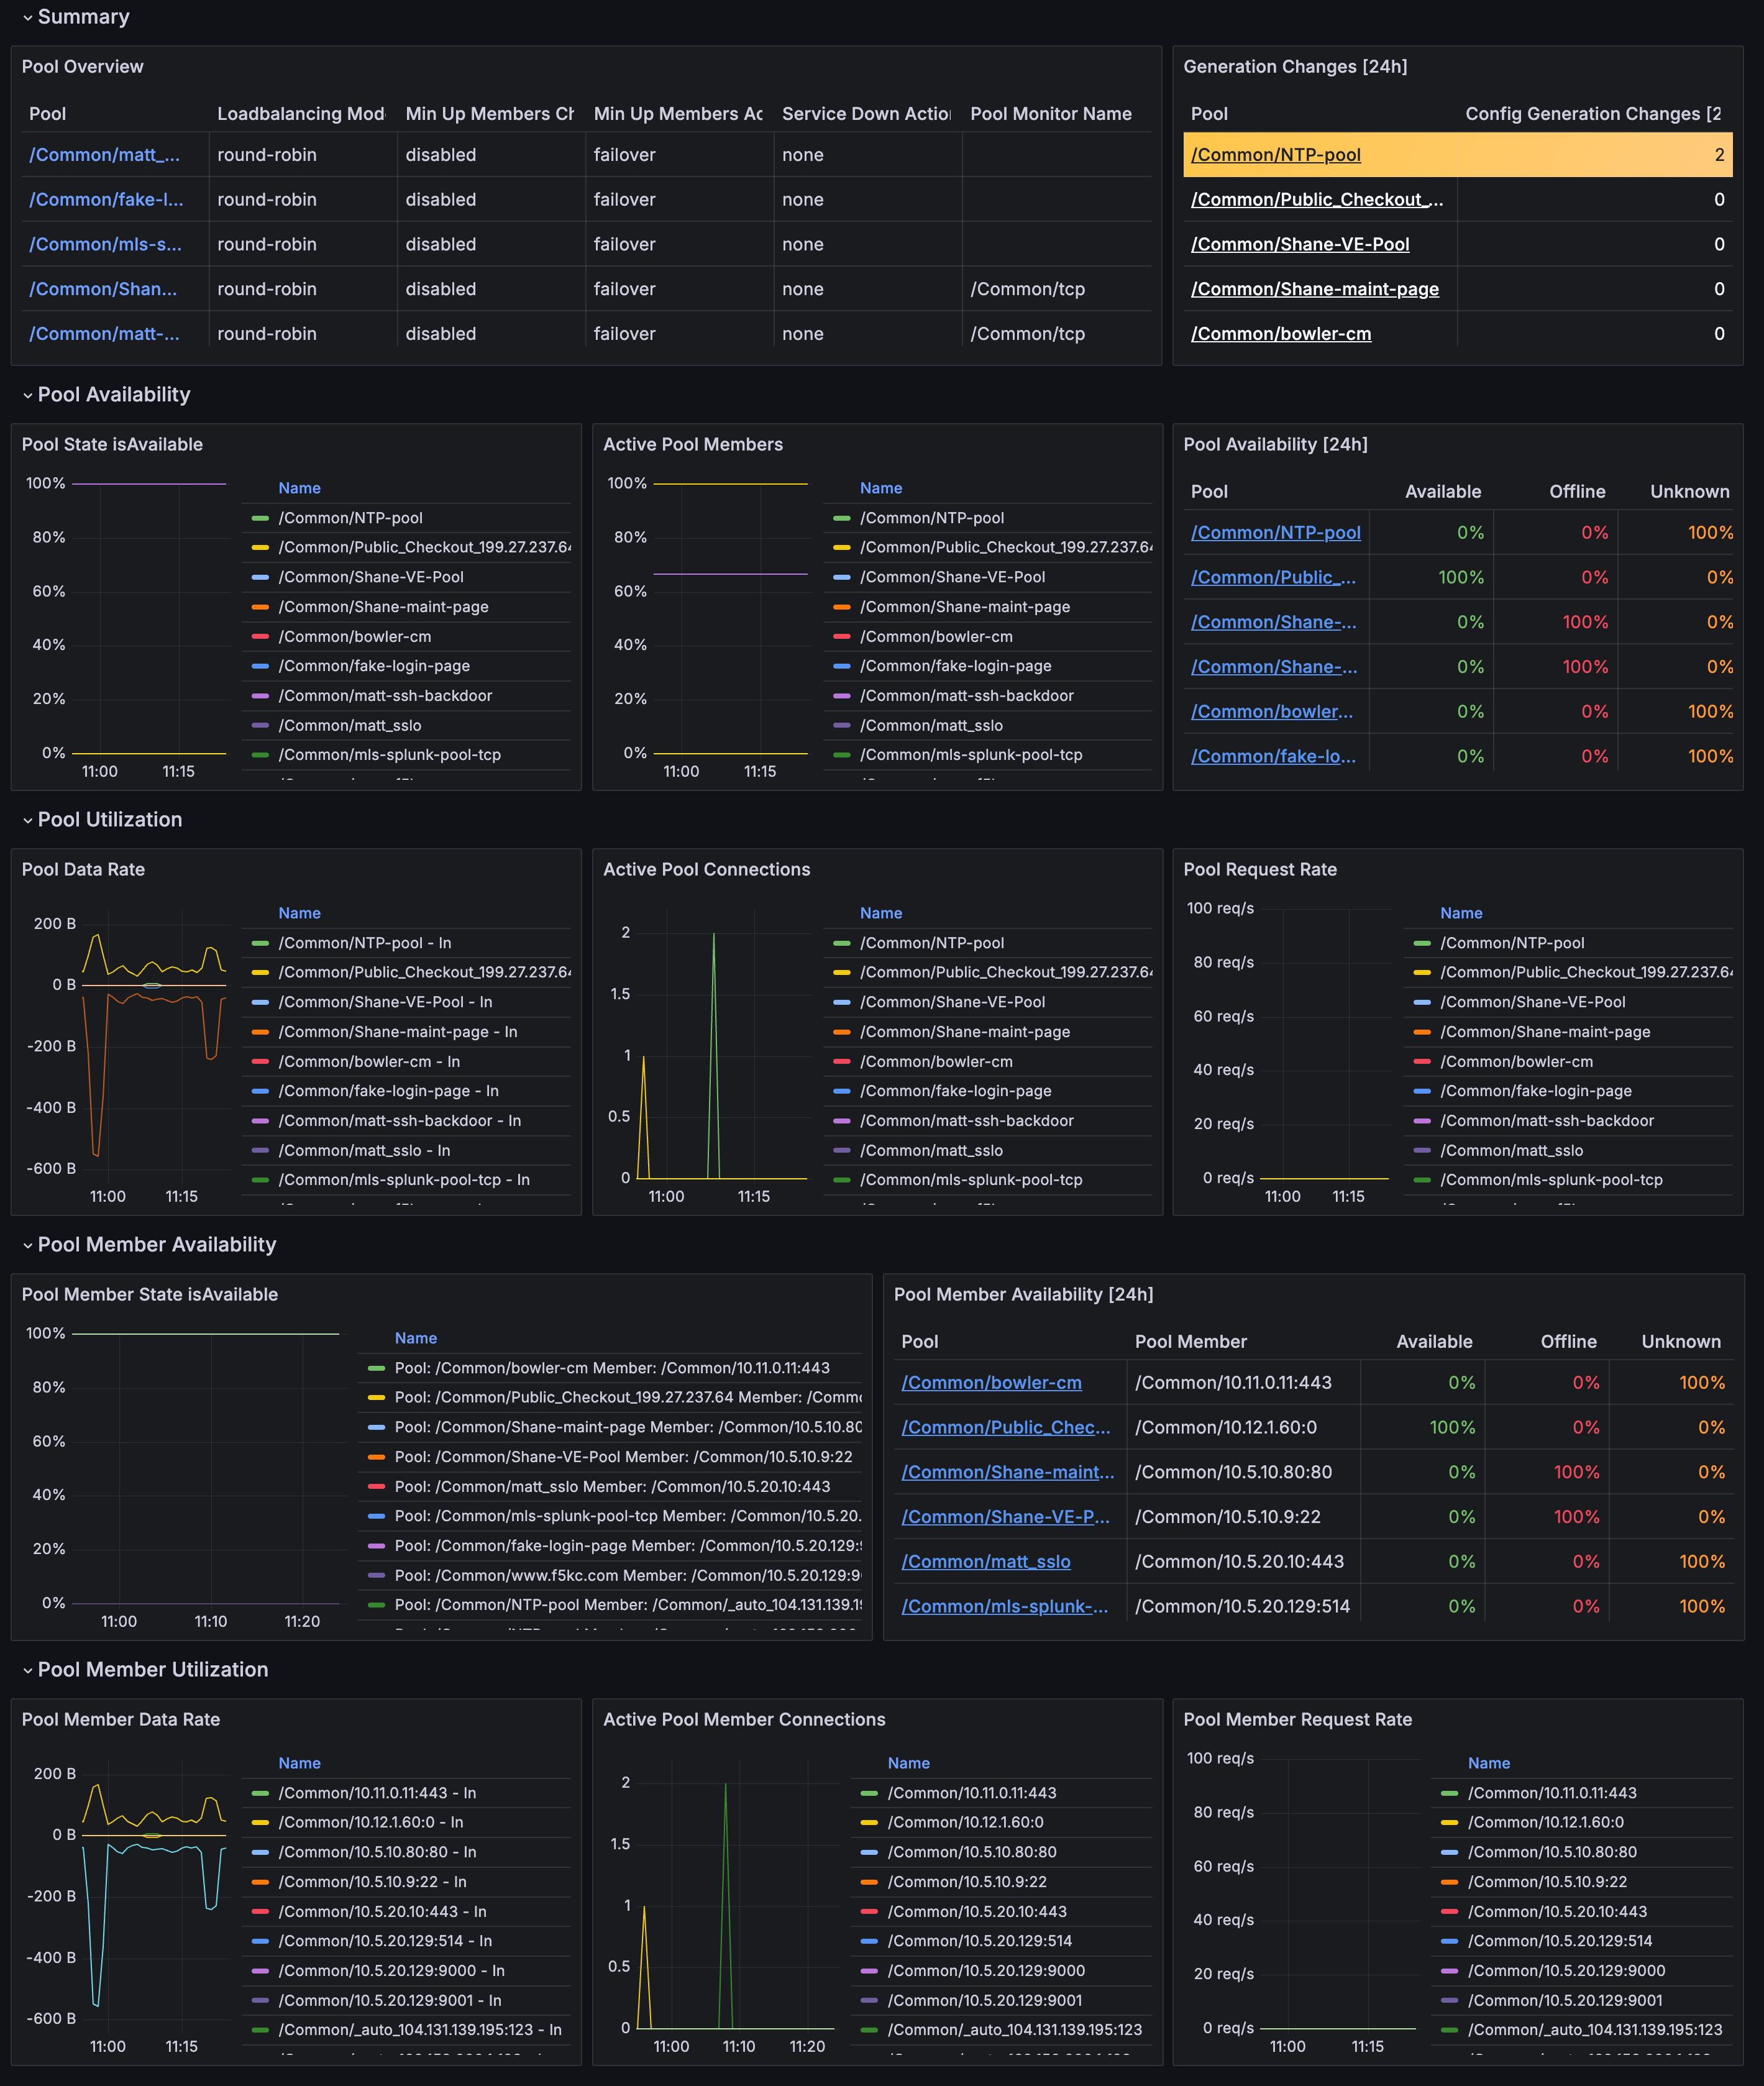
Virtual Servers
Here you can view stats pertaining to all the virtual servers on a BigIP. 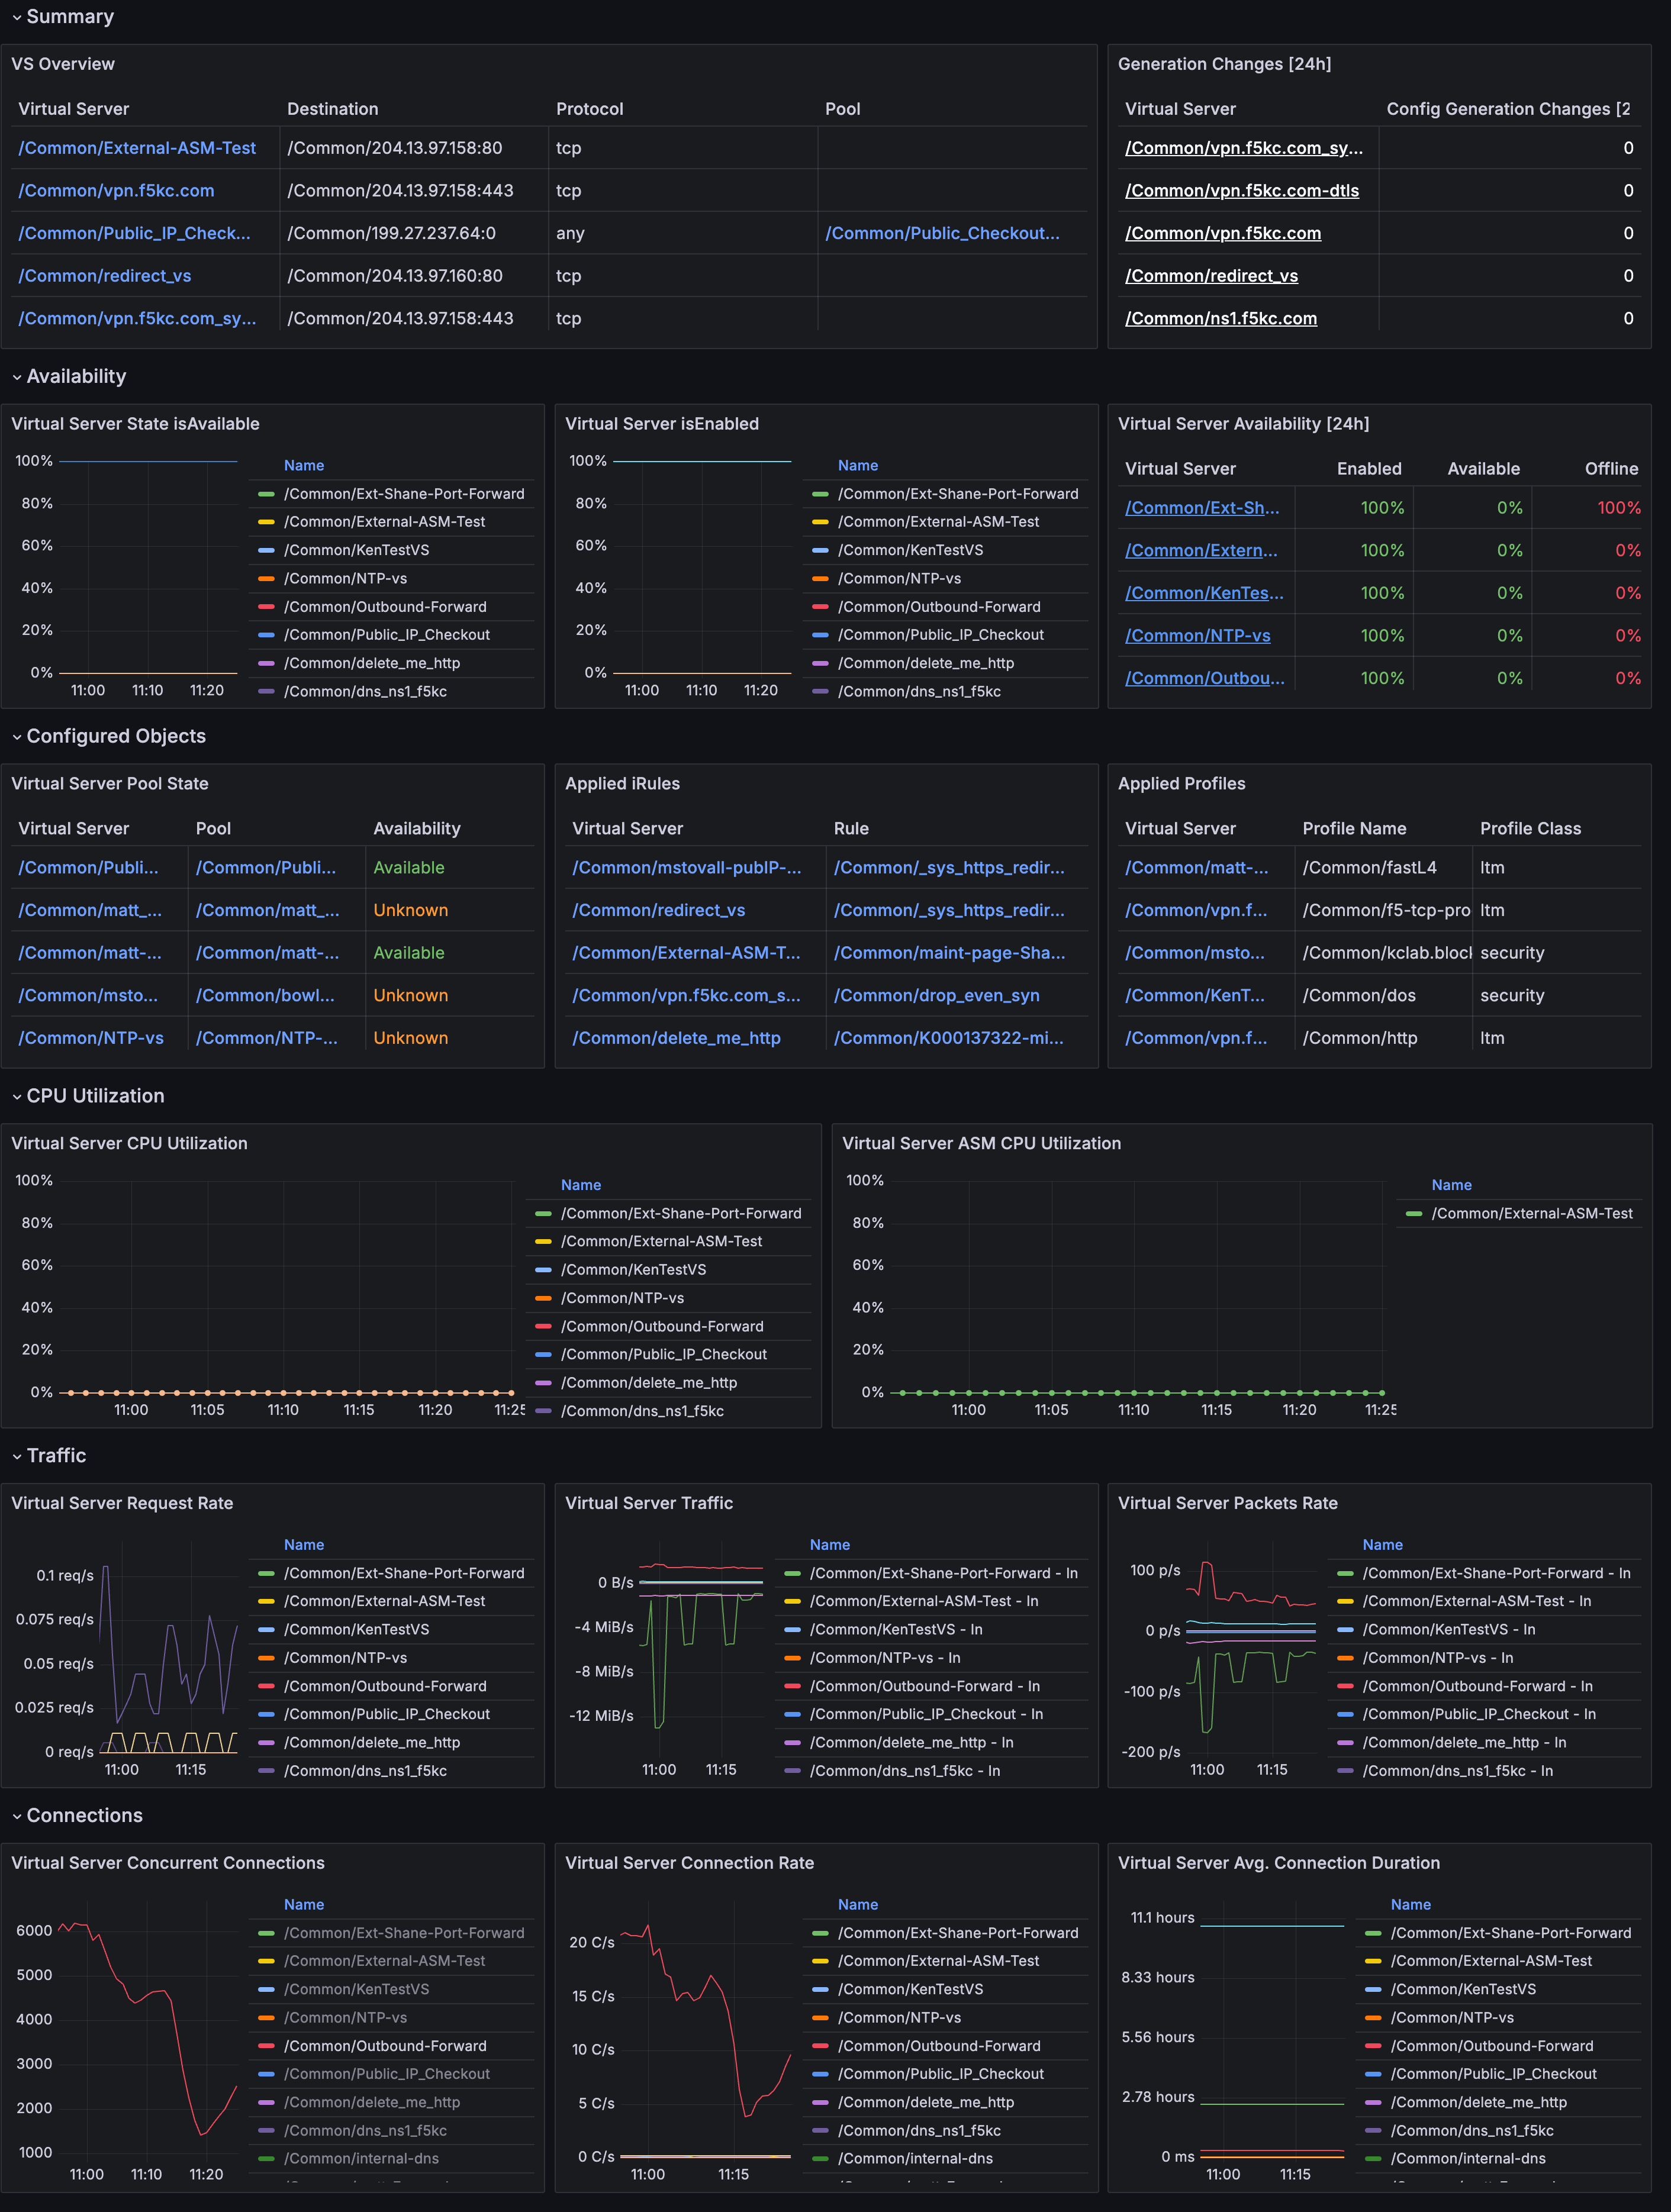
iRules
This dashboard allows you to monitor iRule usage and performance. 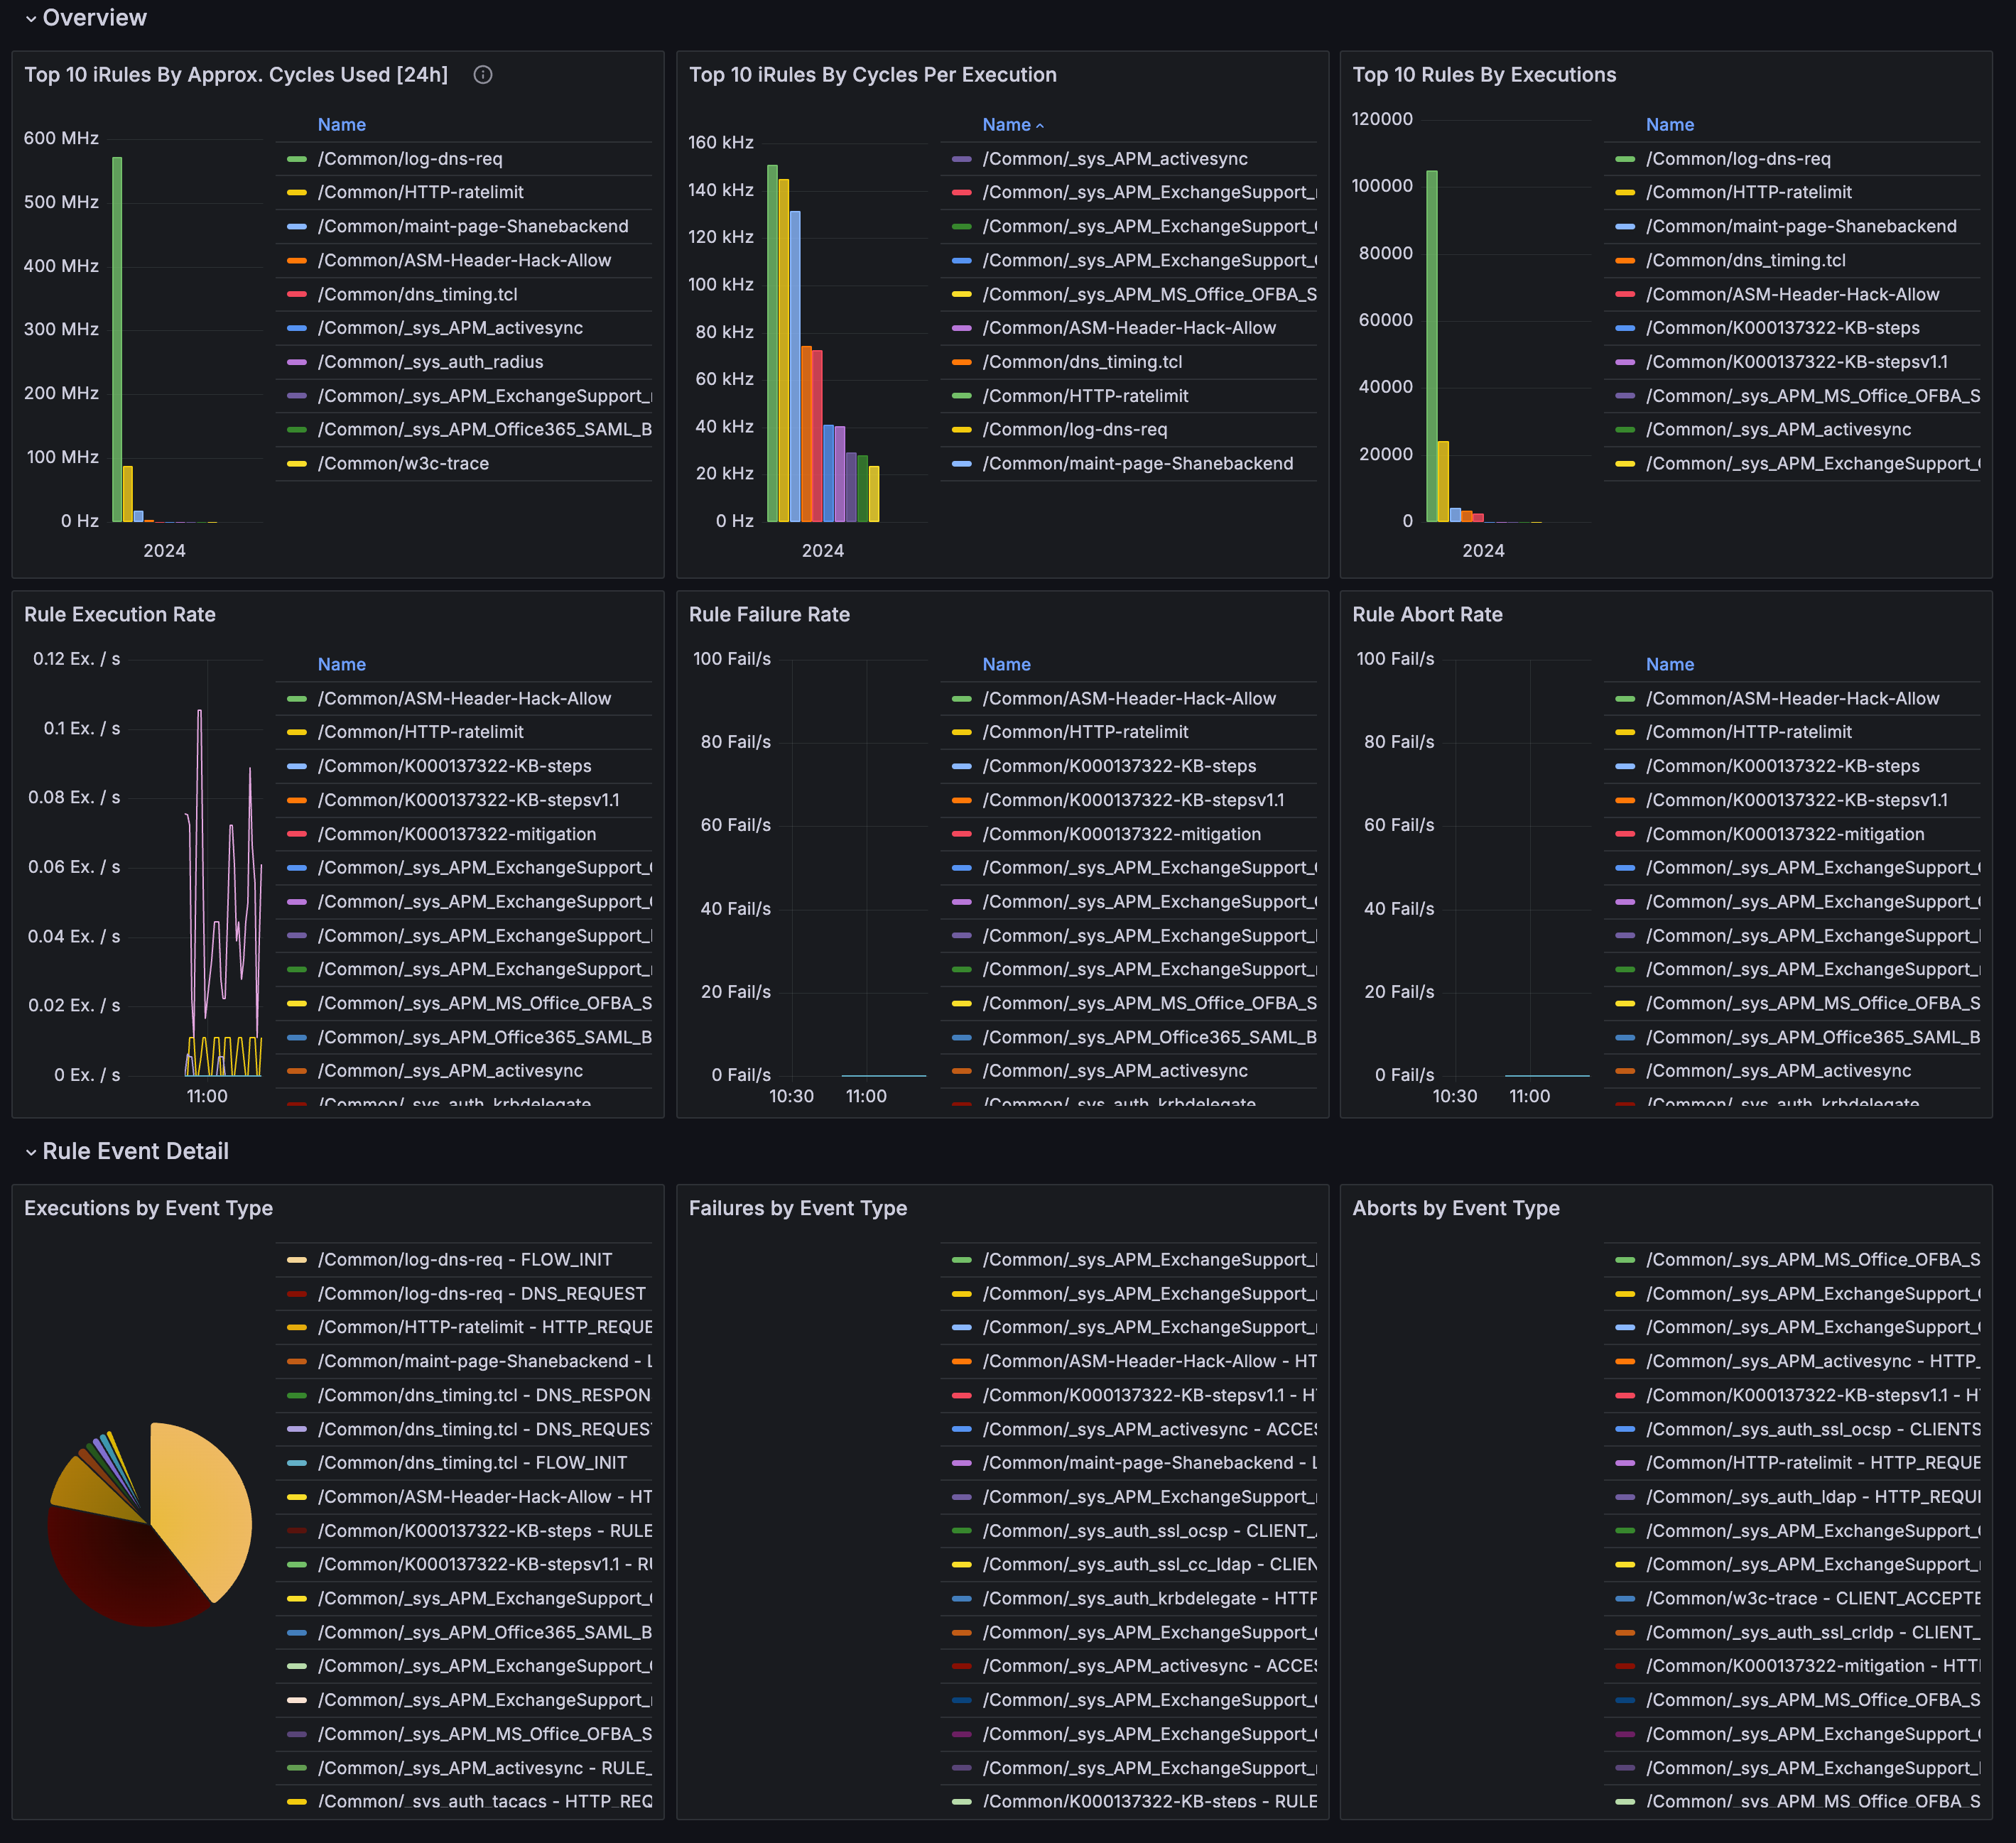
WAF
View the status of your WAF policies here. 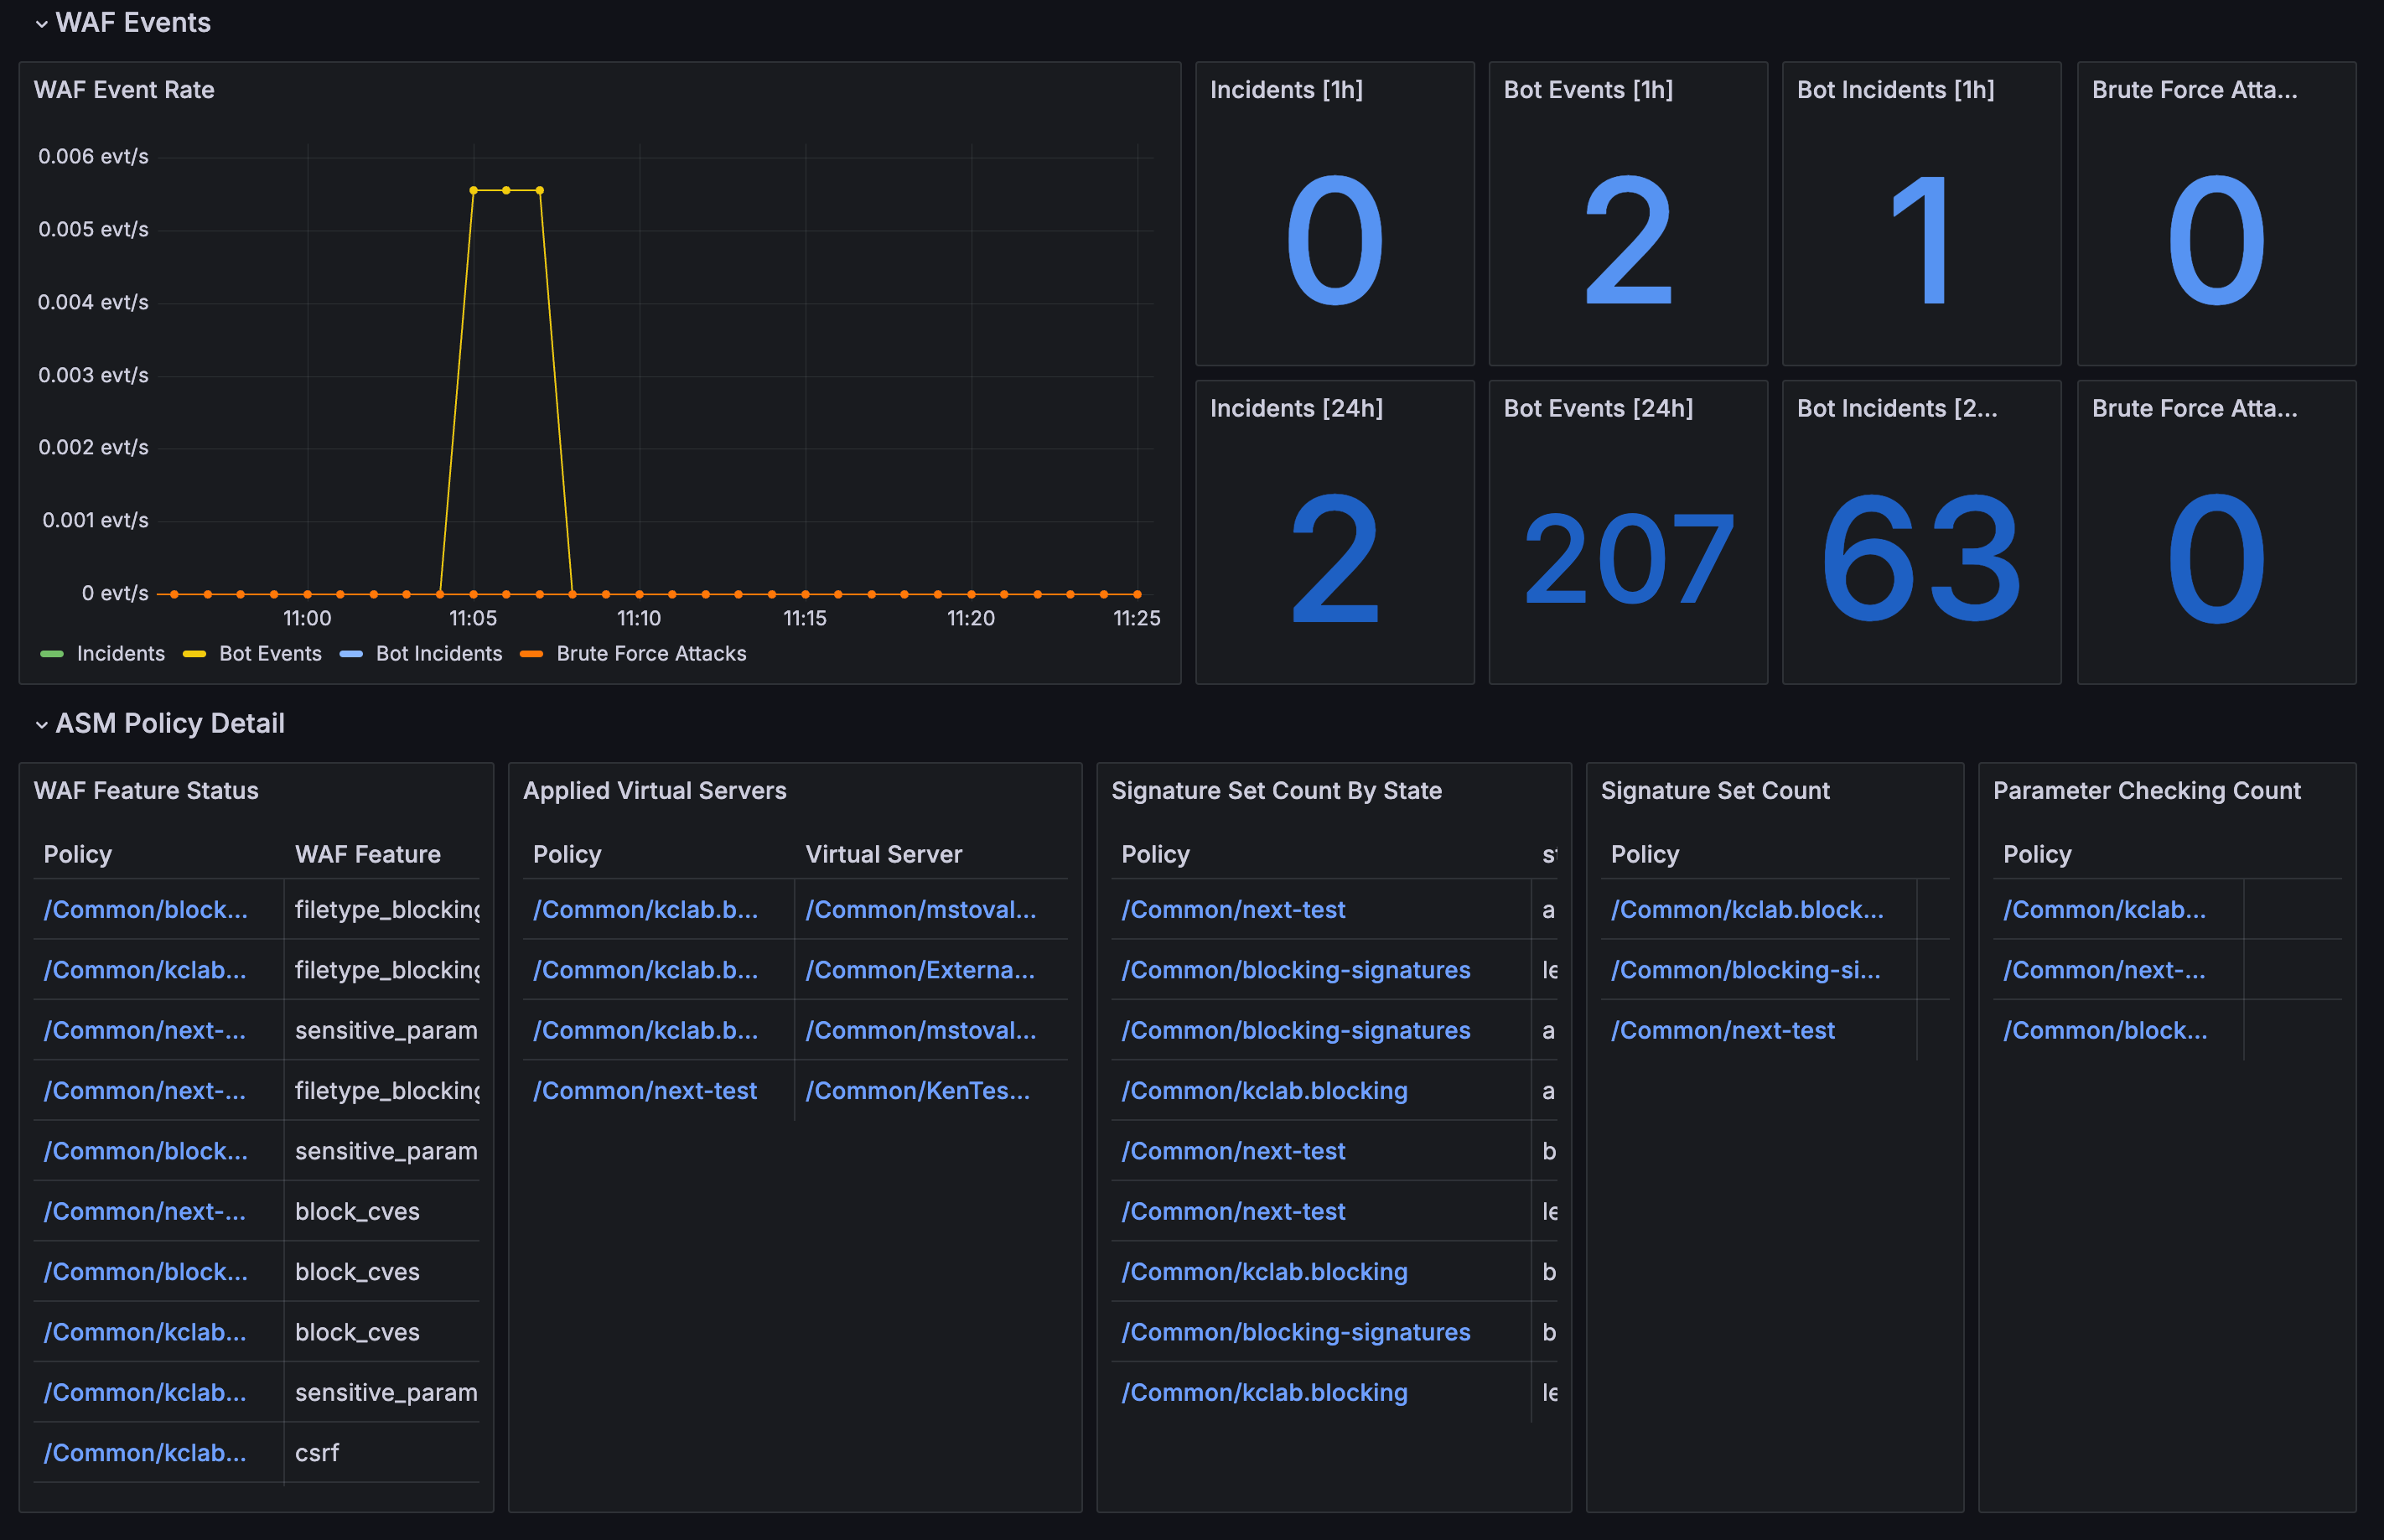
Profile Dashboards
The profile dashboards dive into the different profiles configured on the devices and provide metrics about the traffic the profiles are receiving
HTTP
This dashboard enables the user to monitor their HTTP profiles, view information pretaining to HTTP requests and responses 
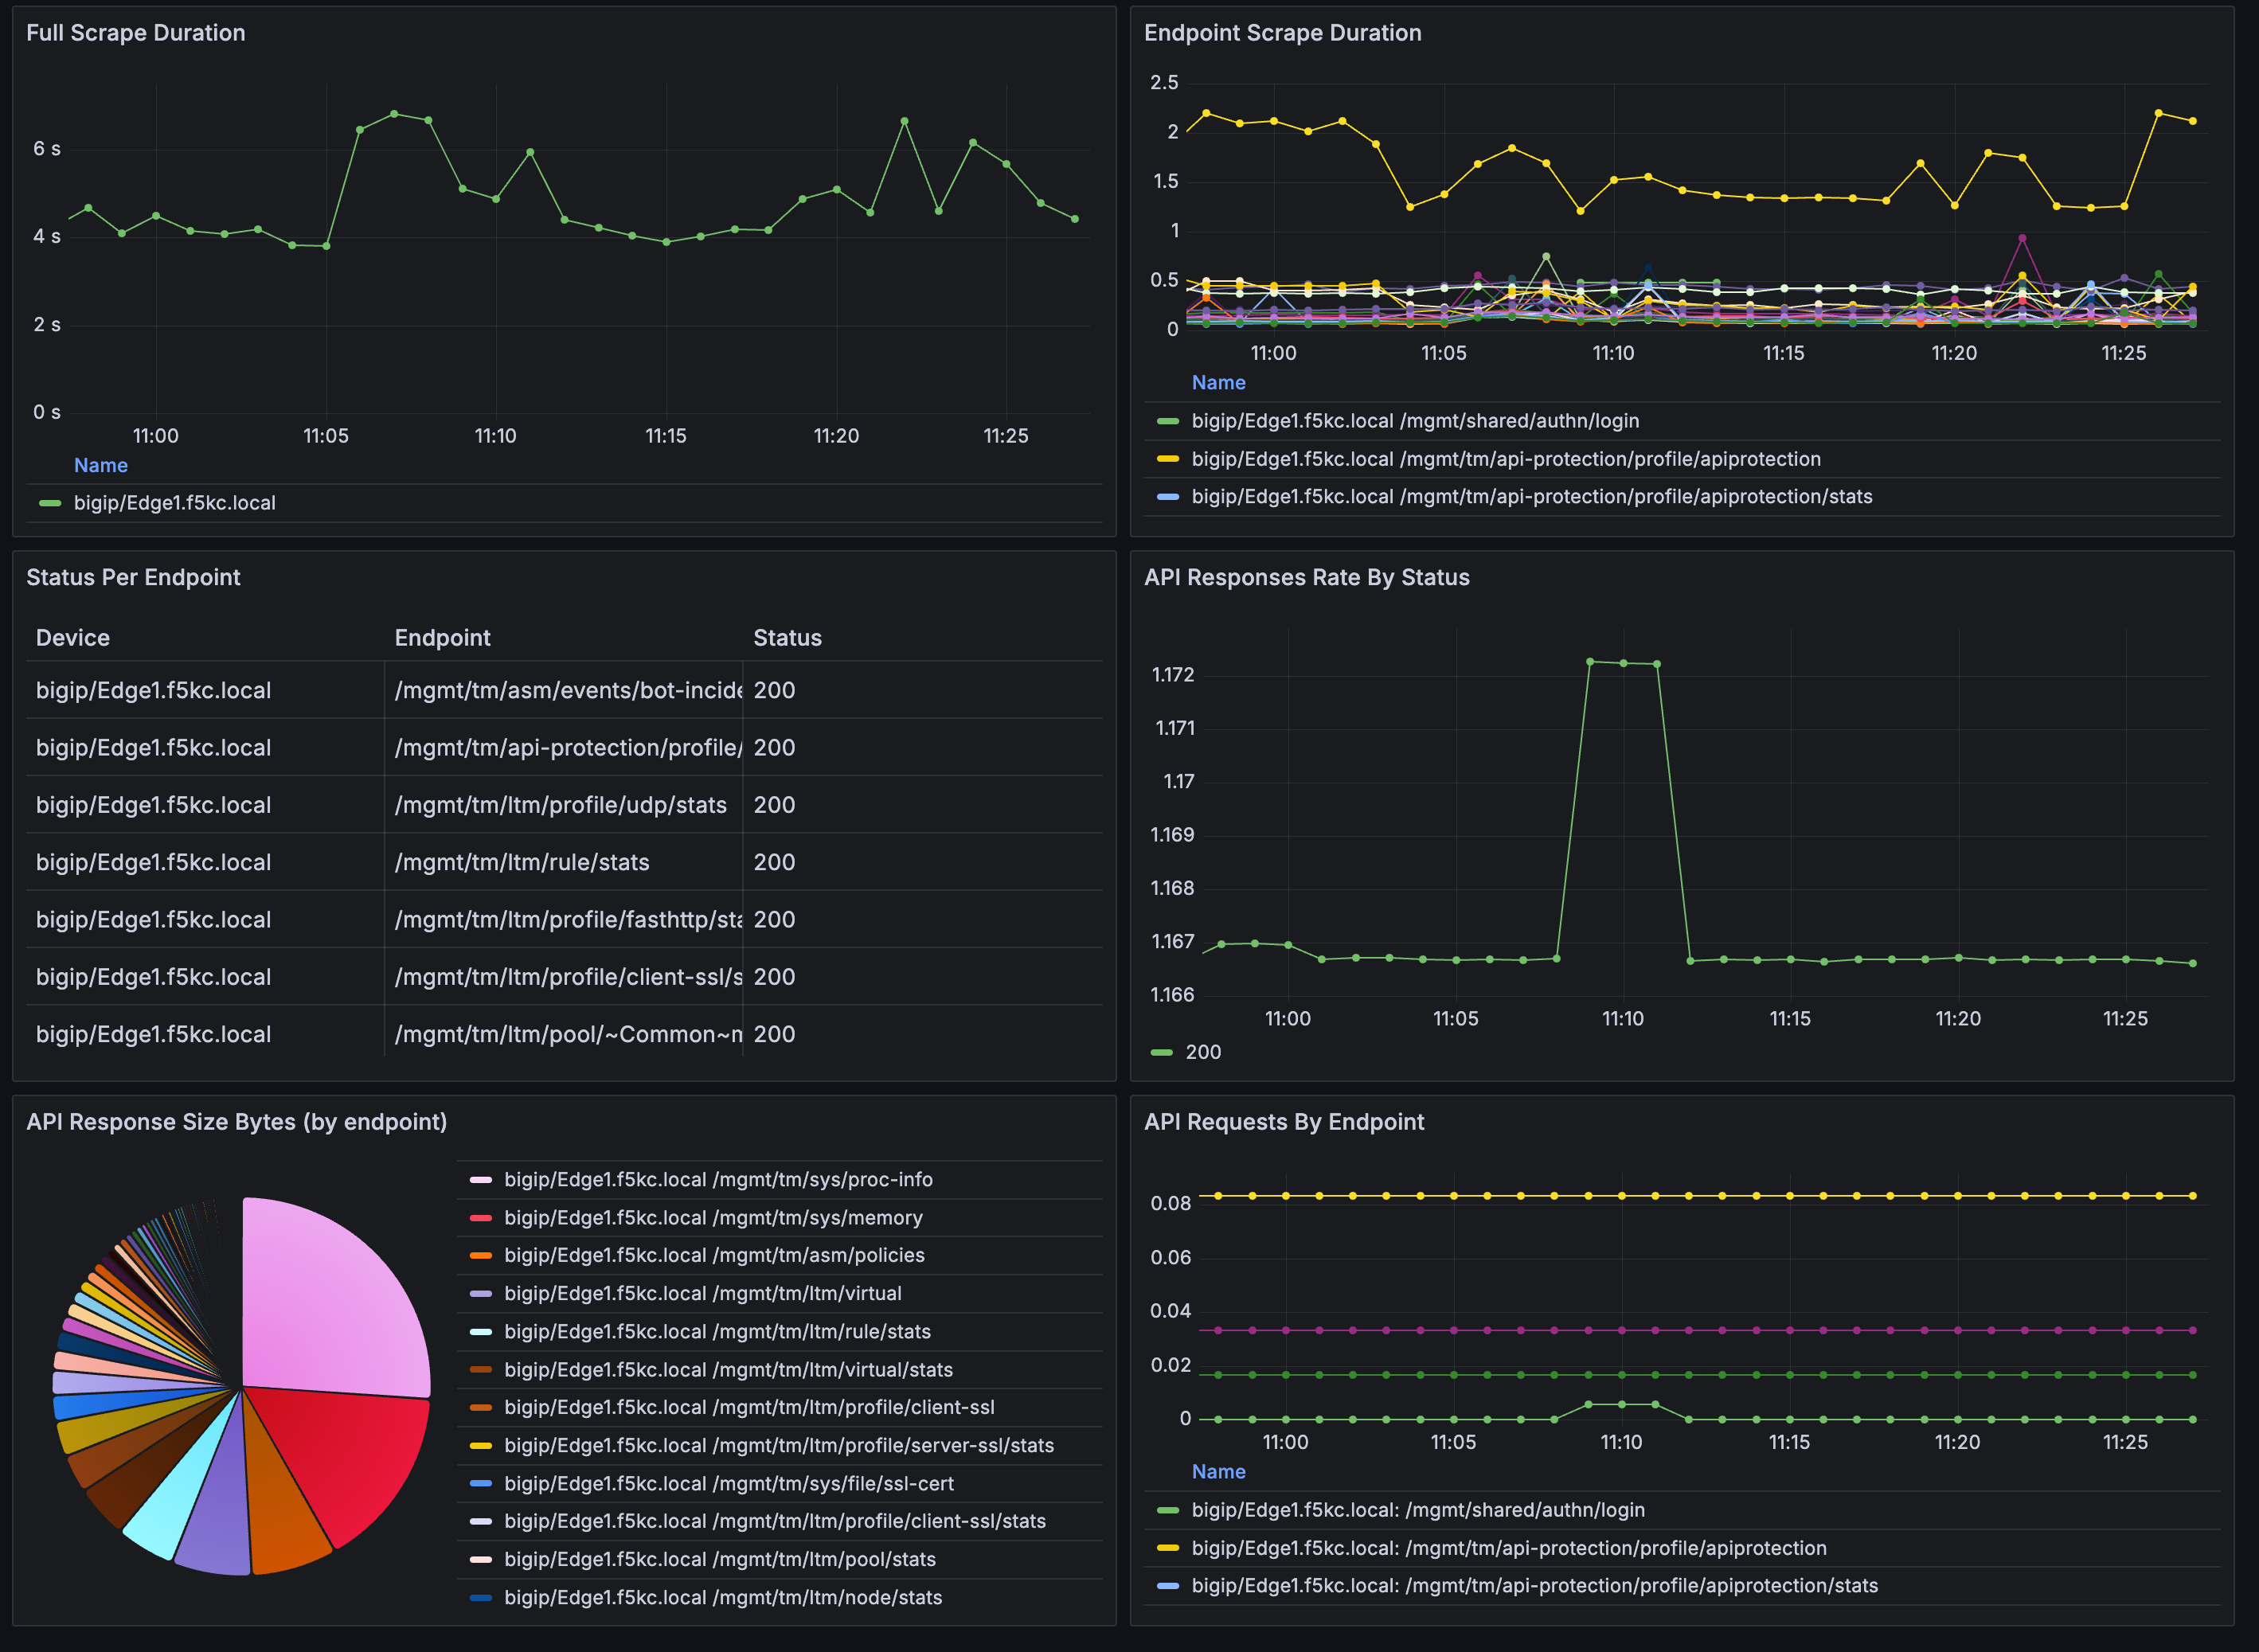
Collector Stats
You can view stats about the Collector from the scrape duration to API requests/responses
